- About

Getting to know us
- Industries
Recent case study:
Oracle EBS Cloud Deployment
Consolidating and Migrating assets into Oracle Cloud Infrastructure.
.png?width=250&name=stonewater-logo%20(1).png)
Most Visited Pages
-
- Resources
DSP-Explorer acquires leading Oracle Applications Managed Services Provider, Claremont, to further extend its data management capabilities.

Resources
- Contact us
Application Performance Monitoring
Contents
In this blog, I want to allocate a quick moment to consider Oracle's Application Performance Monitoring (APM) service, reviewing its purpose and scope, where it can be applied and to what effect, from the perspective of APEX development and support.
The APM service itself is technology-agnostic and not specific to APEX. Configurable to work with any browser-based, Java, and .NET applications, there are also APIs so that custom sources can be integrated as well as integrated with open-source tracing tools such as Jaeger, Zipkin and those that support OpenTelemetry.
What is it?
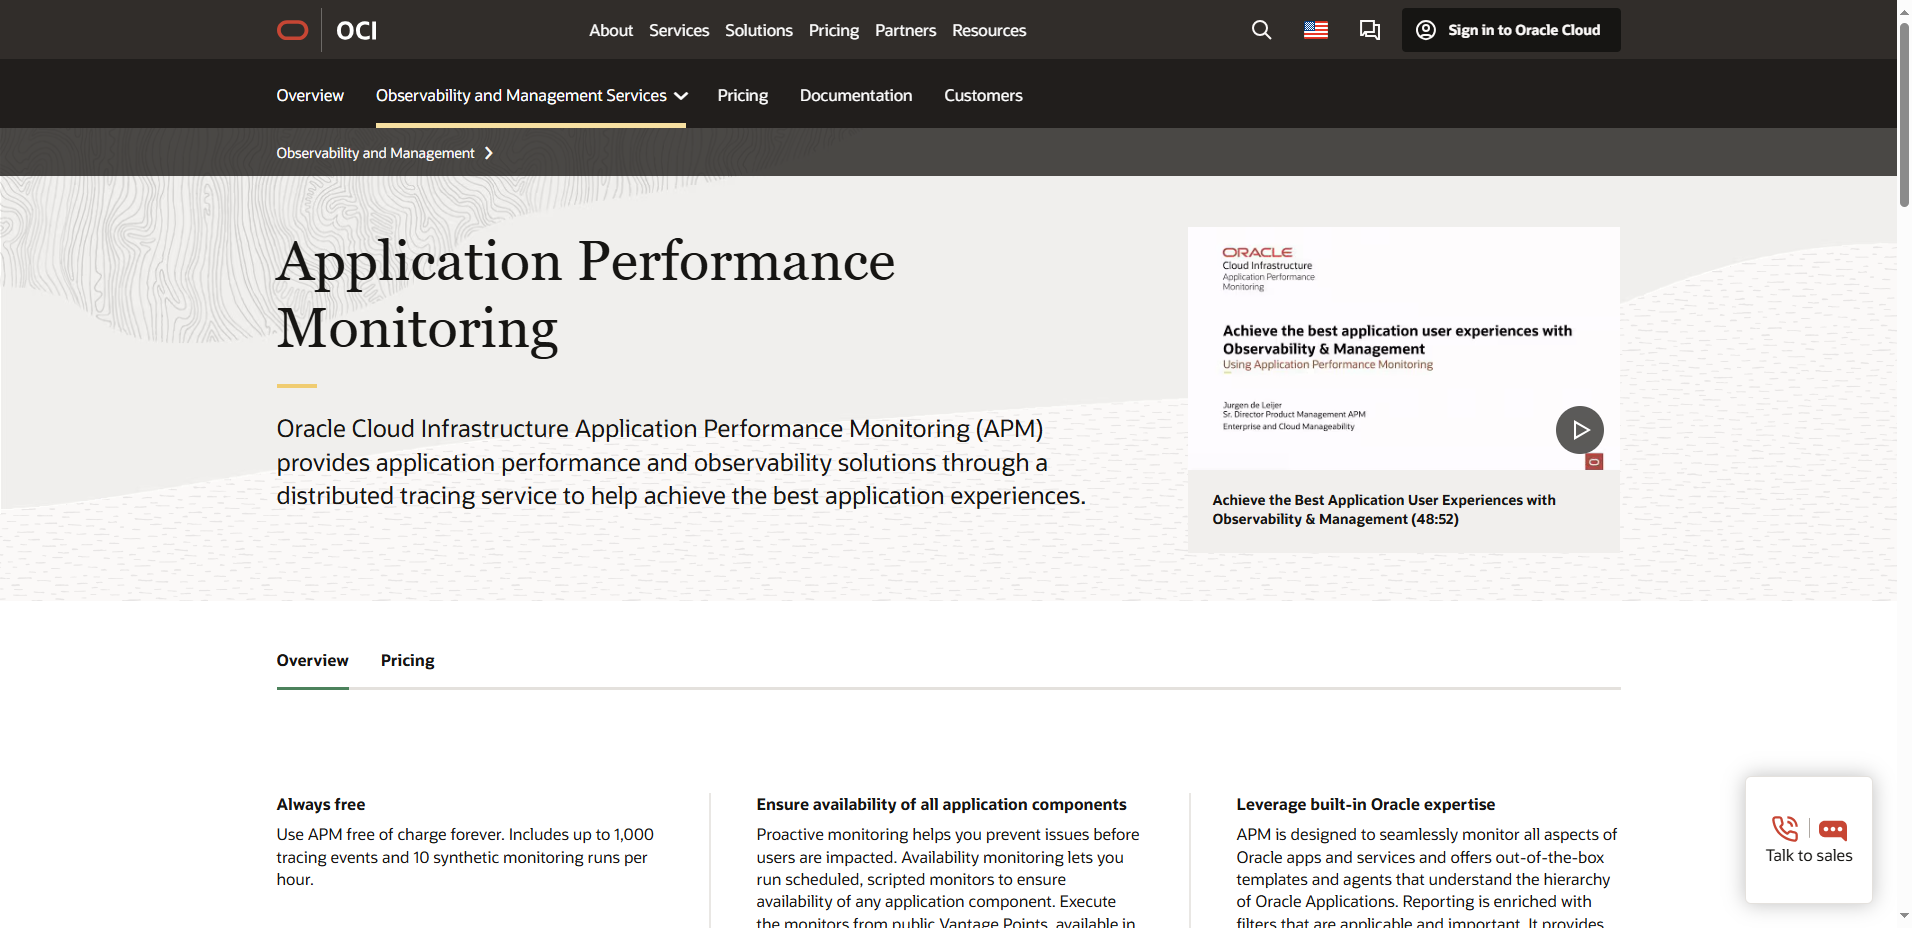
Oracle's Application Performance Monitoring (APM) solution is described as "provid[ing] application performance and observability solutions through a distributed tracing service to help achieve the best application experiences".
One of the solutions included within APM is Real User Monitoring (RUM), which is "[a] solution to track the actual experiences of each end user all the time – no matter where and how they access the application".
Broken down further, RUM covers:
Session Diagnostics
"See what pages were opened and what UI components were clicked leading up to a user issue".
Page Diagnostics
"Performance of individual AJAX calls; loading and execution of files, images, stylesheets, and JavaScript libraries".
JavaScript Error Analysis
"Each JavaScript error that is detected on the browser is logged along the span for the browser activity".
The above excerpts were taken directly from Oracle's APM product page [1].
The Scenario
Have you ever had a support ticket that just says… "application slow"?
I have, and I'm sure you have as well – across different users, environments and APEX applications. It's not reflective of us as developers; we could test an application for 100 years, but as soon as it's deployed to production, there will always be an encounter with a nuanced combination of events no one could've predicted - that leads to a problem.
So what should we do about it? Unfortunately, "application slow" isn't very informative and doesn't give us much to go on. Further conversations with the user in question might not help much, either...
Support: "Can you show me what's happening, please?"
User: "It's working fine now."
Support: "What were you doing at the time?"
User: "I just clicked this button."
Support: "What were you doing just before you clicked the button?"
User: "I can't remember, sorry."
Support: "How often does it happen?"
User: "Seems random."
Support: "When did it first happen?"
User: "A few months ago now."
It's not the users' fault; they're not Developers or Quality Analysts. They expect software to 'just work'... and why shouldn't they?
Ultimately, we need more information to help us diagnose and then fix the issue. However, some of the worst sins I can think of in this scenario are asking the user to submit another ticket with more information the next time the issue occurs and/or asking them to collect and export browser logs.
Asking for another ticket comes across as disinterest at best, and for the average person, collecting logs is confusing and burdensome.
Both options create a barrier to future issues being reported. While a reduction in reported issues might sound nice in the short term, the problems are still there, and dissatisfaction and resentment between departments can slowly creep in.
How many issues go unreported because users have often had a poor support experience?
APM to the rescue!
The scenario described above is quite typical and an example of 'reactive' support. But let's try to be proactive instead.
What if, instead of relying on the user to notify us of poor performance or errors, we already knew?
What if, instead of relying on the user for additional information, we already had all the information we needed?
What if, instead of investigating the experience of one user, we could see the experience of ALL users?
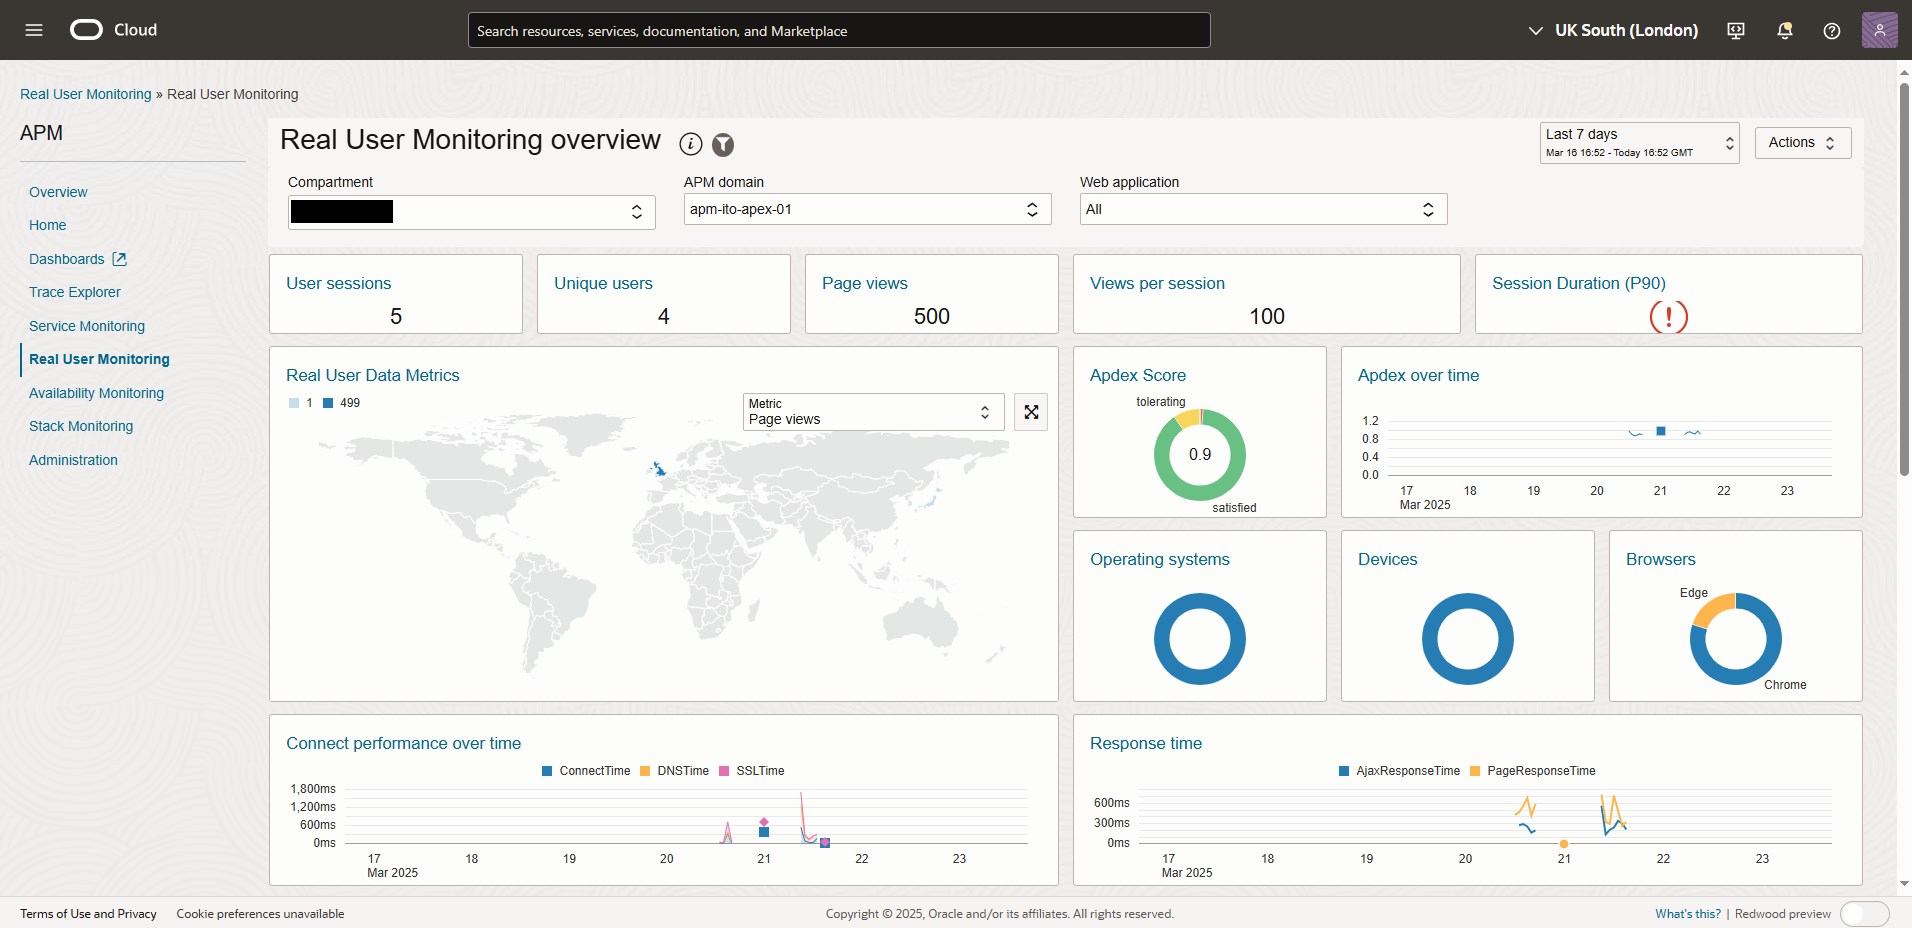
Real User Monitoring provided by APM covers all that and more. Instead of evaluating a user's experience only when an issue occurs, we move to evaluating all users, all the time, combined with the storage and exploration of application logs from a central location.
There is a calculated Apdex score that allows us to see the overall experience our users are having at a glance [2].
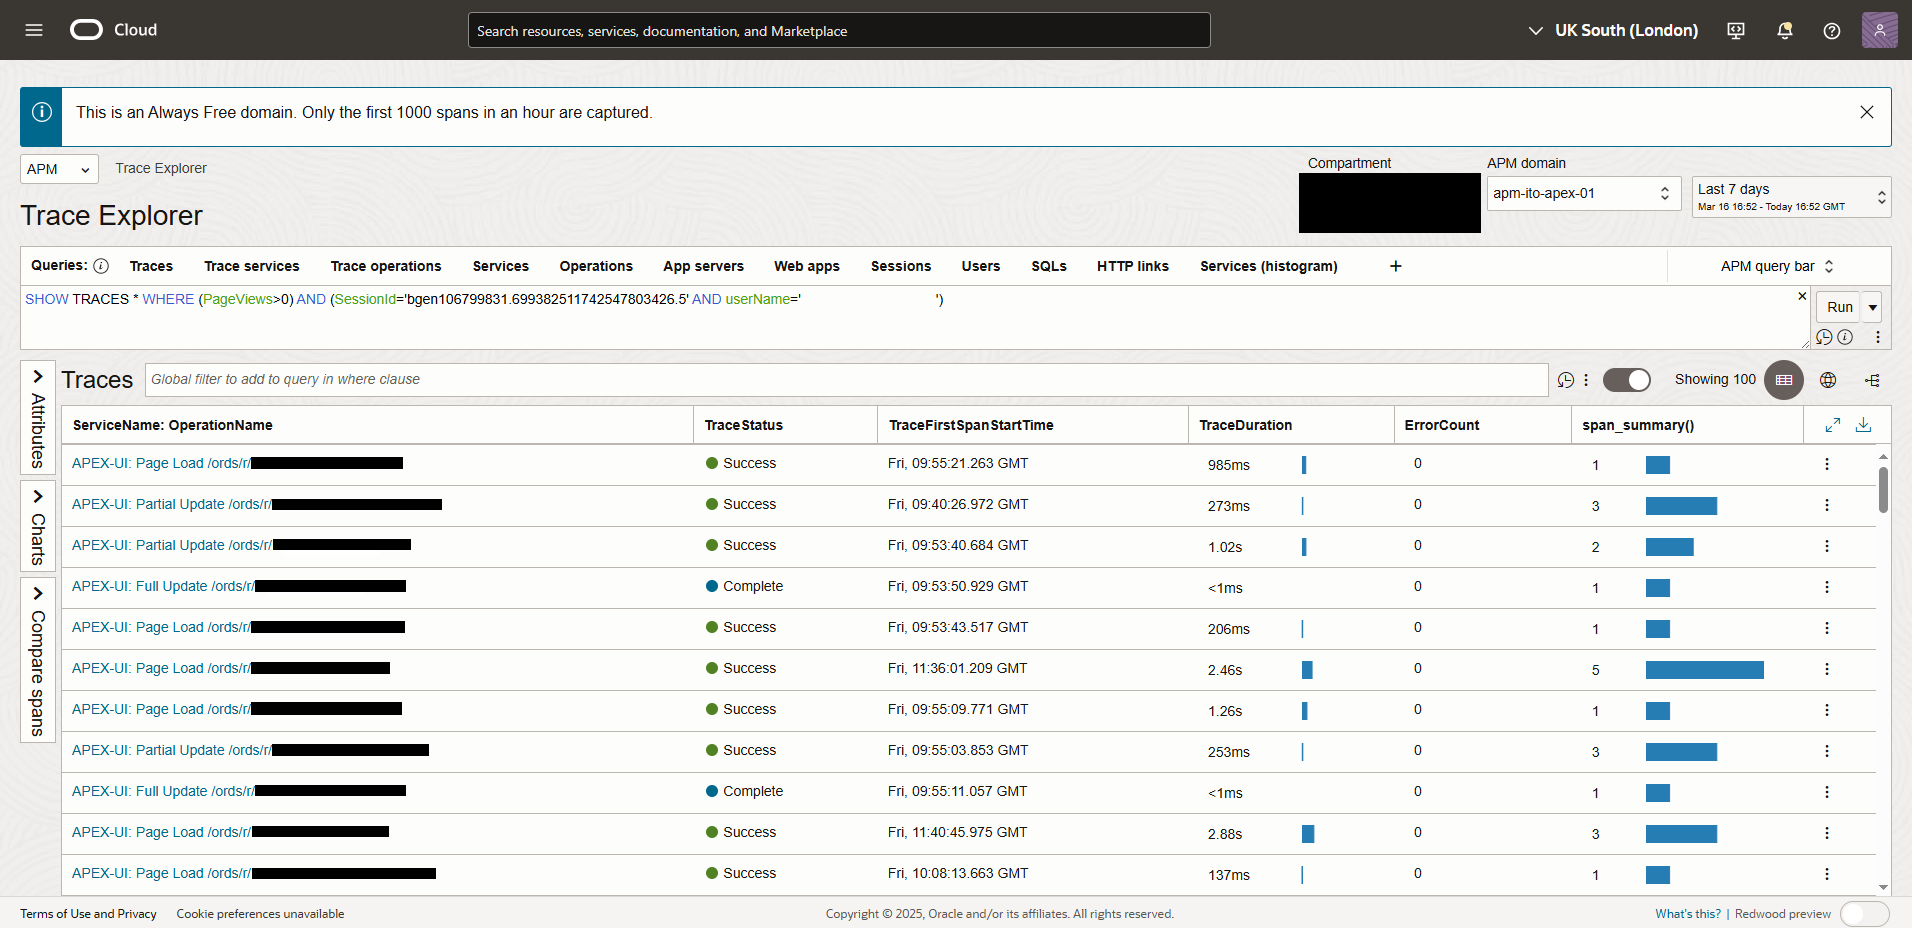
We can also drill down into specific user or session-associated events, get an overview of page or partial page load performance and see what JavaScript errors are being reported in the browser.
Doesn't APEX log events?
It does! However, its reporting is mostly focused on counting database events across different dimensions as opposed to building a picture of all user interactions for a given user or session. It's also limited to those events that generate a database action, either through page load, page submit or AJAX callback, which means there will be a lot of browser-level-only user interactions that aren't included.
By far, the most useful view for me here has been the Application Errors report. It shows PL/SQL execution errors across all users, as well as the associated PL/SQL Call Stack, which gives me a great head-start on debugging and resolution without users having to notify me.
My advice would be to monitor the Application Errors report as well as the new information found within APM. Why choose when you can have both?
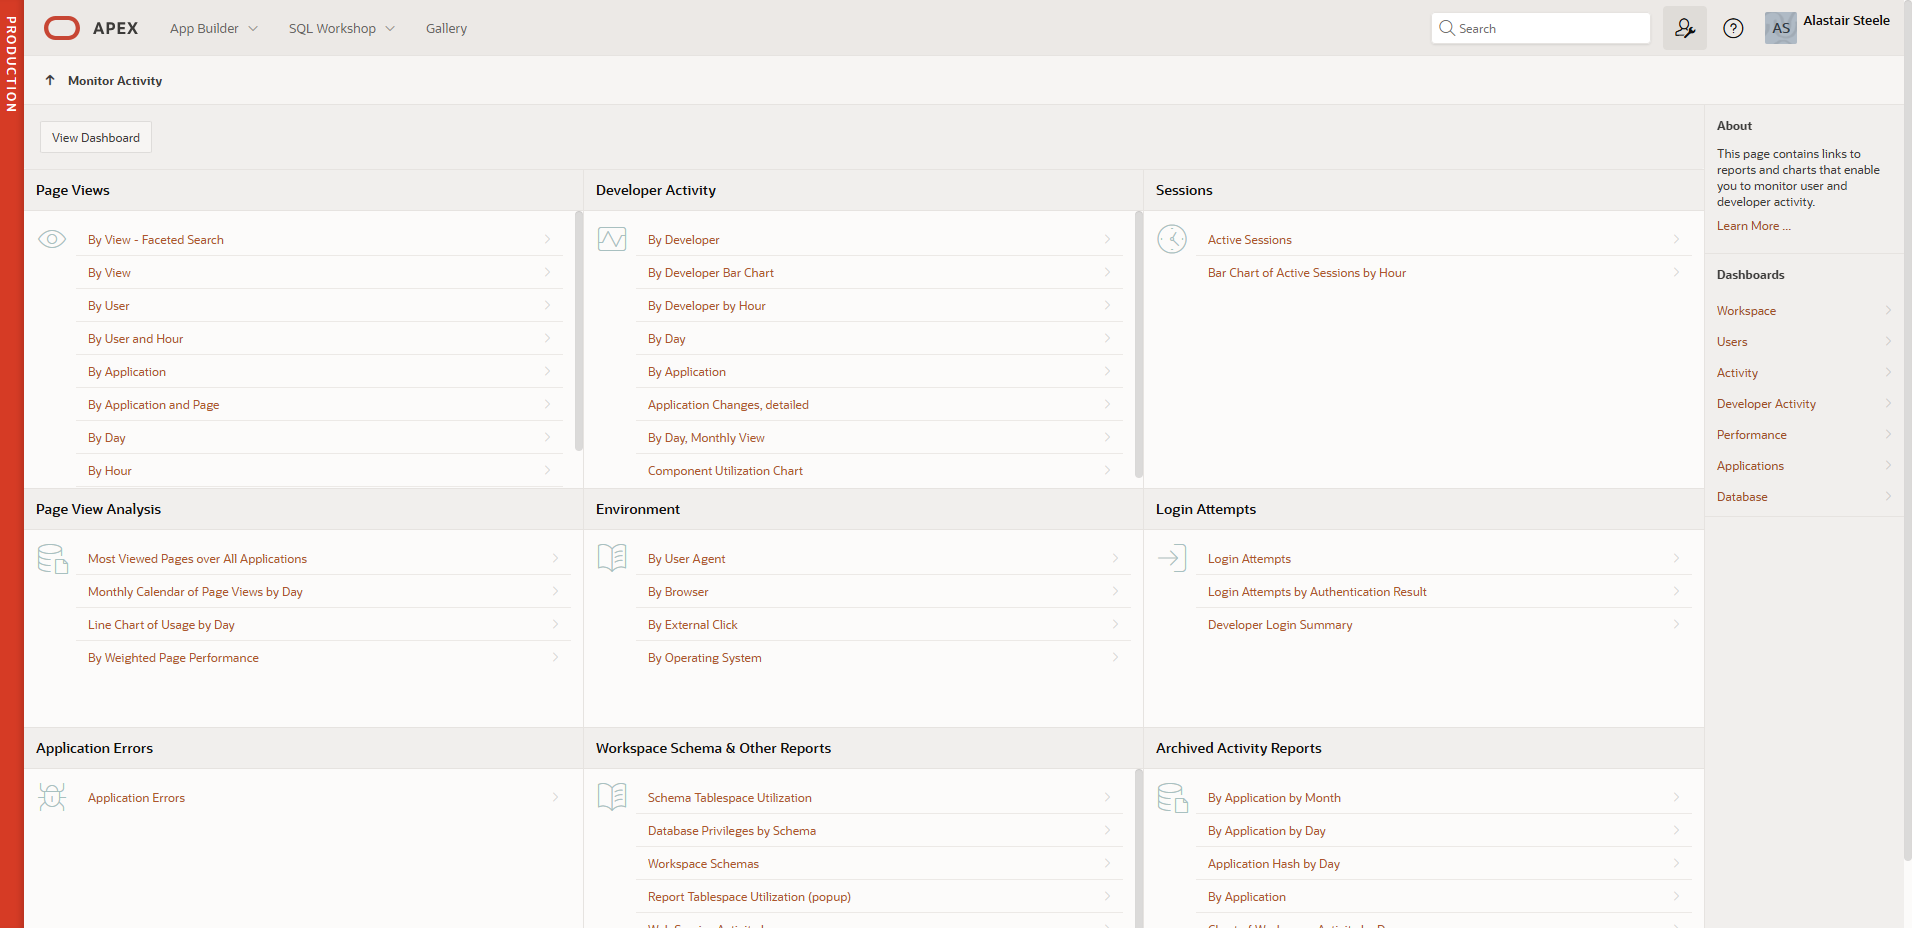
The Monitor Activity page can be found under the Administration menu (user with spanner icon) in the top right.
Getting started
Hopefully, I've convinced you to take a closer look at APM and its capabilities. Getting started is unbelievably easy; it'd be criminal not to. To set up APM for your chosen application, I can recommend following the video from the Oracle provided README, which includes further information and advice, such as how to link logged events to your database Performance Hub view to see associated SQL query information and importing an APEX specific dashboard.
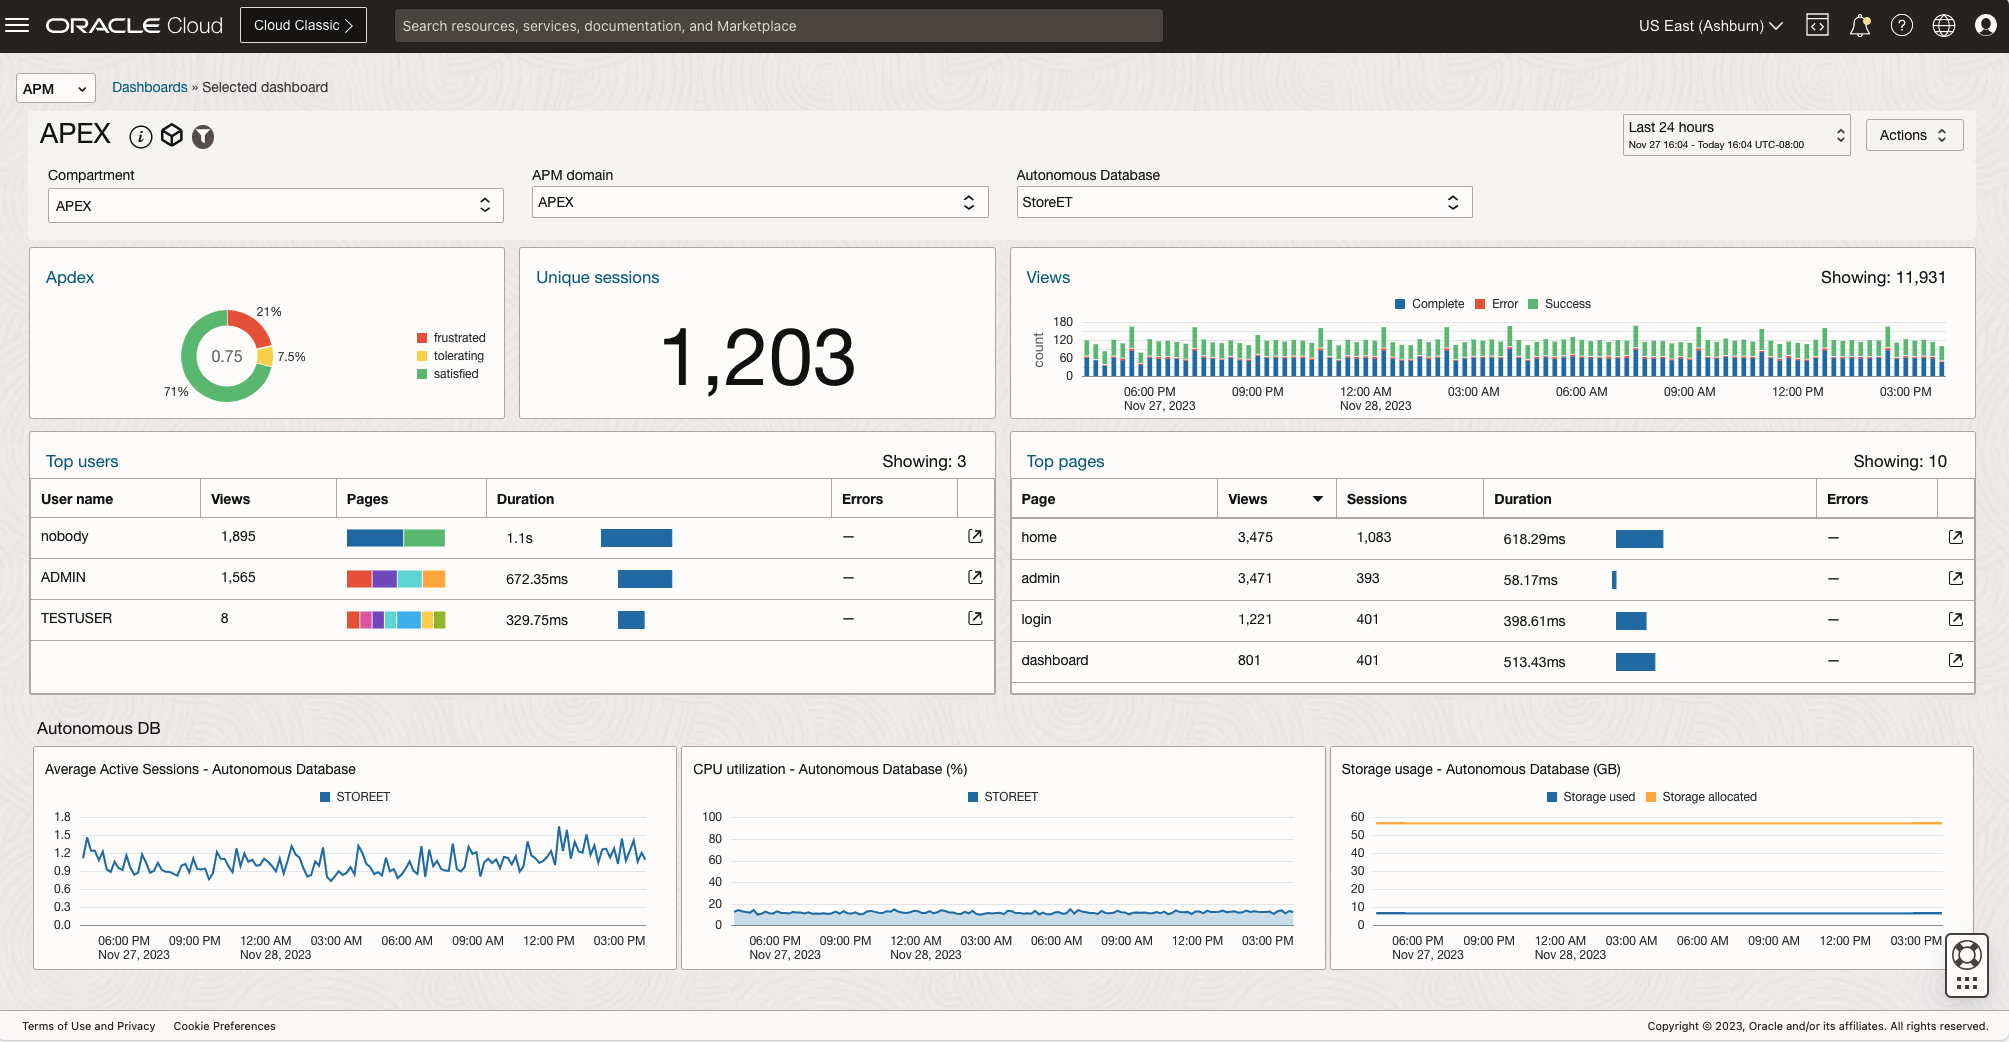
Image taken from Oracle provided APM setup GitHub page [3].
You get 1 'Always Free' APM domain per tenancy. This includes:
- Up to 1000 spans per hour (additional spans ignored)
- 31-day storage for trace data
- Up to 10 monitor runs per hour
This should be plenty for a moderately used application and enough to realise an immediate benefit.
Also, when adding the required global page region, use a server-side condition to ensure it only loads in your Production environment and/or Test and Development environments as required. Or, if used in all environments, you can change the webApplication name in each so that you can easily filter down to the environment you're interested in.
If you have a heavily used application you need to monitor, you could also use a server-side condition on the global page region to target specific users /user groups to make the most of your Always Free allowance.
Conclusion
While APEX does come with its own Application Errors report, that only tells half the story. To see the other half (at no additional cost and minimum effort), you should check out APM with the view of adding it to your bug-busting toolkit. You'll be surprised how empowered it can make you as a developer when you can see exactly what actions are causing your users the most frustration and react accordingly without ever needing a ticket. They'll certainly be grateful and remember - IT is invisible when it works.
For more information, check out our Oracle APEX Services, and if you liked this blog, check out our other APEX blogs here.
Contact us today, and one of our expert developers will be in touch.
[1] https://www.oracle.com/manageability/application-performance-monitoring/
[2] https://www.apdex.org/
[3] https://github.com/oracle-quickstart/oci-o11y-solutions/tree/main/knowledge-content/oracle-database/APEX/apm