- About
Getting to know us
- Services
- Managed Services
- Application Services
- Cloud Services
- Data Science
- Consulting Services
- Technology Solutions
Managed Services
Application Services
Data Science
Consulting Services
Technology Solutions
- Industries
- Resources
Resources
- Contact
- Contact us
APEX Report Performance
Contents
Recently at the UKOUG TECH18 Conference I gave a presentation entitled ‘Choosing the Right Report & Features to Give your Users when Presenting Data in an APEX Application’ which you can read more about here. During the presentation, one of the common problems with report regions in APEX I addressed was on the subject of their performance, and the potential for users to become frustrated with a poorly performing page in an APEX Application caused by the report region. The purpose of this blog post is to summarise some of the things I talked about in the presentation on APEX Reports and their performance, and also to mention some other things I have learnt, both from general day-to-day development, and from other presentations, at the conference. There are a number of different report types in APEX (something I covered more in-depth in the presentation) but to summarise these are the built in report types in APEX:
- List View
- Classic Report
- Column Toggle Report
- Reflow Report
- Interactive Report
- Interactive Grid
- Chart
- Tree
- Calendar
Report Types
Further to this, the following region types could potentially also be considered report types:
- PL/SQL Dynamic Content
- Plugins
These different report types allow you to very quickly present data from the database (or also from a web source as is becoming more popular) to the page in the browser as HTML. This operation is predominately carried out by the APEX engine which takes the report type selected, the attributes and parameters set against the region, and also (probably most importantly!) the source which has been entered against the region by the developer.
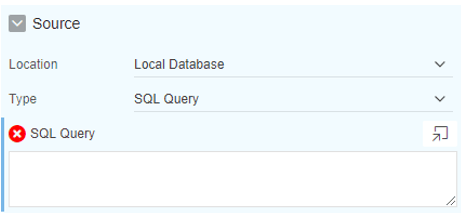
What the developer enters as the source for the report is probably the single biggest factor when it comes to performance of rendering the report region. If you write a poorly performing SQL statement in the source then quite simply the APEX engine is going to suffer from the same difficulty in quickly retrieving the results as you would if you were running the query directly on the database from tools such as SQL Developer. This blog post isn’t a guide on how to write efficient SQL, there are plenty of resources, books and training on that; But, essentially, the first point for this blog is that if you write efficient SQL in the first place, then this will vastly improve the performance of rendering pages and also the refreshing of reports (from things like dynamic actions) in the first place. So, although this isn’t a performance guide below are the type of things you should be thinking for your source query when writing the SQL (or view):
- Don’t use *, return the columns you need.
- Use of Indexes and Foreign keys on the database
- Ask your DBA to Gather Statistics
- Sensible Joins on indexes/foreign keys
- Optimizer Hints (shouldn’t be required very often)
- Table and column aliases
- Use of Materialised Views (if appropriate)
- Avoiding the SQL <-> PL/SQL switch latency time where possible
- Load and Volume test – More on this below
After writing your efficient SQL for the report source an often forgotten task is a Load and Volume test. This is actually an important one; when you are developing a new application, you may only have a small amount of data in your schema for testing but you really should be considering what the data will look like in a production environment, both immediately at go-live and also after the application has been ‘live’ for X amount of time, how much is the data likely to grow? There is an abundance of tools available for generating test data for your database but how and what you generate will usually be dependent upon your schema and application. You may have to write some custom PL/SQL to generate the test data so this should be taken in to account in estimates and project plans. The next thing to address is how exactly, for an APEX application. you can see how well your report SQL (and also other SQL or PL/SQL) is performing and also what you can do to debug it. There are, of course, a variety of tools available for monitoring your Oracle database such as Oracle Enterprise Manager or SolarWinds which will monitor your database for any long running SQL amongst many other things. However, APEX itself, providing you have it enabled in the workspace, has a great built it Activity Monitor. There are two particular reports to highlight:
- Page View Analysis > Page Views by Weighted Page Performance
- Active Sessions
Using these two reports you can quite quickly identify poorly performing pages and where users might be getting stuck. The data for these reports is held in the APEX metadata so also it’s quite easy to lift the information out to front end from the views apex_activity_log and apex_workspace_activity_log. Once you have identified a poorly performing piece of SQL or page how can you then investigate and diagnose this in APEX? Well APEX has a built in debugger! When you render a page in debug mode every transaction is logged but most importantly for us, how long the transaction took (in seconds) is also logged, so you can quite quickly identify the troublesome statement which is causing your page to take a long time to load:
Beyond the tuning. Ok, so sometimes, you may have already tuned your query or materialised views aren’t appropriate and yet your page/region is still taking a long time to load. What can we do to either solve this or at least handle it better so that users don’t become frustrated or at least understand why they are waiting? If the number of rows returned and the pagination of them is a contributing factor for poor performance, then you should really consider adding page items to your page, the value of which is then referenced in the source for your report (using bind variable syntax). Adding a dynamic action which means the report is only displayed if the user enters/chooses a value in the page item means that the number of rows returned can be significantly reduced before the query is actually ran on the database. You should make sensible decisions on the report features and options which you have enabled on interactive reports (and interactive grids – although this can be more complicated!). I discussed this in more detail during my presentation but to summarise:
- Disable filters on large text columns
- Disable sorting on columns which could impact performance
- The IR search box works by using a ‘like’ where clause, be aware that this can break indexes and sometimes not perform very well.
- Essentially, any option which you have enabled on any report type should be tested to ensure it does not cause a performance issue.
Format masks or HTML Expressions
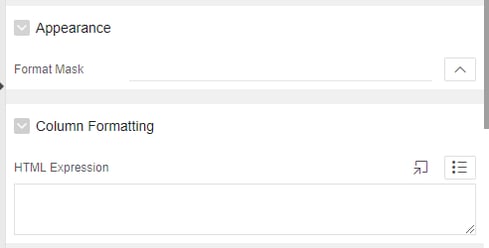
When applying format masks or HTML Expressions to columns, always try to do it in the column attributes of the report in the APEX Page Designer, rather than inside the SQL (or view). Any formatting is then done by the APEX engine after the query has executed on the database to return the data.
Consider utilizing Region Caching. If you have a report where the data either doesn’t change much or it isn’t required to be up to date, then region caching can really help as it saves the query having to be re-run on the database for every page view and instead the APEX engine stores the generated HTML for the region to be sent for the next user who requests it (depending upon the options you set). It’s a hugely underutilised feature of APEX in my experience and one that can really help.
In a recent blog, Maxime Tremblay suggested a good way to stop the time taken to run the report query from interfering with the initial page load by not having the report query run during the rendering process, and instead fire it off with a dynamic action after the page has loaded. The net effect is that the page loads quickly (users prefer this!) and the report displays the spinning refresh icon until the data is returned from the AJAX request. This can really improve the user perception of how a page is performing without actually increasing the performance at all. So that’s it for now, performance in APEX is a large topic, so expect some more posts from me in the future on the same subject but for now I hope this helps with giving you some ideas of what you should be doing to help performance in your APEX applications, in particular for reporting.
For more information, check out our Oracle APEX Services, and if you liked this blog, check out our other APEX blogs here.
Contact us today, and one of our expert developers will be in touch.
Author: Paul Jones
Job Title: Oracle APEX Development Consultant
Bio: Paul is a Development Consultant at DSP. Paul has a BSc in Computing from the University of Leeds and is now building on considerable experience in development and support using Oracle PL/SQL and Oracle E-Business Suite (EBS). Paul is employing APEX to provide quality, bespoke software solutions both internally and to a range of organisations.

.png?width=250&name=stonewater-logo%20(1).png)


.webp?width=489&name=APEX%20report%20types%20(1).webp)

