

- Services

Getting to know us
- Industries
Recent case study:
Oracle EBS Cloud Deployment
Consolidating and Migrating assets into Oracle Cloud Infrastructure.

Most Visited Pages
-
- Resources
DSP-Explorer acquires leading Oracle Applications Managed Services Provider, Claremont, to further extend its data management capabilities.

Resources
- Contact us
What parkrun data can tell us about consistency, community and prevention
Contents
A free, volunteer-run weekly event offers a practical blueprint for any organisation trying to build healthy habits at scale.
Prevention is hard to prioritise because its payoff is slow and spread across many people. Business leaders and health planners alike tend to favour interventions they can launch quickly and measure in a quarter. parkrun is a useful counterexample: a simple, free, community-run 5K that has quietly built a weekly habit for hundreds of thousands of people. The inspiration for this analysis was parkrun’s article, “New data shows parkrun’s savings to NHS England”, which prompted us to explore what publicly available event data could tell us about the behaviours behind that impact.
To see what that looks like in practice, we looked at the public event histories of three parkruns: Woodhouse Moor (Leeds), Southwark and Alvaston. Here is what stood out, and what it means for organisations designing programmes that need to last. These locations were chosen because of their proximity to DSP’s offices: Woodhouse Moor for Leeds, Southwark for London and Alvaston for Derby.

1. Consistency Beats Intensity
Looking at the chart below, individual weeks bounce around with weather, school holidays and local events. Zoom out, and the picture is a steady upward line. Southwark grew from about 45 finishers per event in its early days to more than 570 today, with no paid marketing engine and no premium tier.
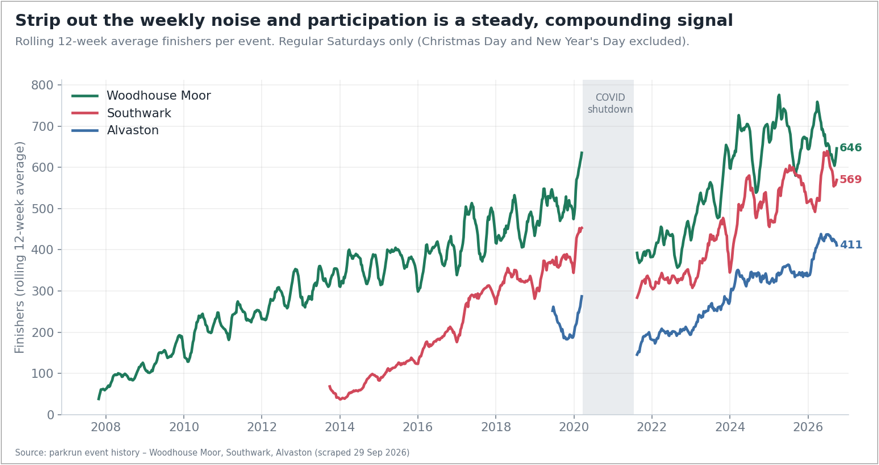 Average finishers per event (12-week rolling average). The grey band marks the COVID shutdown.
Business takeaway: judge a programme on its trend line, not on launch-week spikes. Repeat participation is the asset.
2. A Community-Run Model That Scales Efficiently
Every parkrun is delivered by volunteers, and the data shows the model gets leaner as it grows. Small events need around 12 volunteers per 100 runners; the largest need about 5. Over its lifetime, each volunteer role supports roughly 10 to 17 finishes. Volunteer numbers rise and fall with demand, so this is a flexible rota rather than a fixed headcount, but the cost of delivery per participant falls with scale.
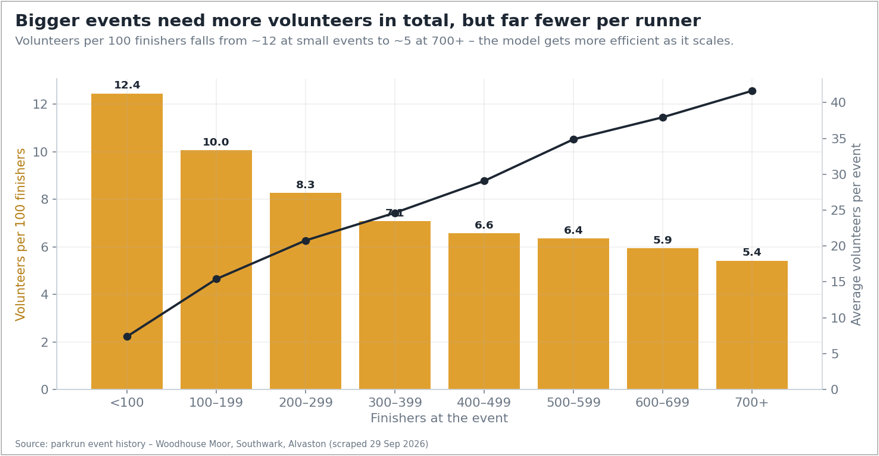 Volunteers needed per 100 finishers (bars) and average volunteers per event (line), by event size.
Business takeaway: shared ownership is an operating model. When participants help deliver the service, scale stops being a cost problem.
3. Resilient by Design
Disruption is the real test of a habit. We found 55 occasions when a single Saturday was cancelled; the first event back drew almost the same crowd as before (about 101% of the recent average). Events have run on 93 to 98% of all possible Saturdays since launch. Even the 497-day COVID shutdown was recovered: all three events were back above their pre-pandemic average in about two years and then kept growing.
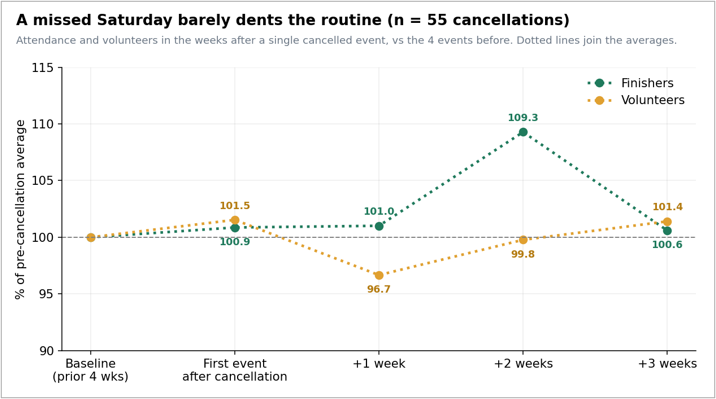 Finishers and volunteers after a single cancelled Saturday, compared with the four events before.
Business takeaway: a simple, predictable routine is far more robust than a complex offer. People return because they know exactly what to expect.
4. Accessibility: What the Data Can and Cannot Show
Accessibility is where public data is thinnest. The event histories we analysed do not include finish-time distributions or first-timer counts, so we cannot directly measure how many walkers take part or how many newcomers arrive each month. What we can see is indirect but encouraging: attendance at the two older events has grown roughly seven to eight times, while the winning times have barely moved. The growth comes from the wider public, not just fast runners.
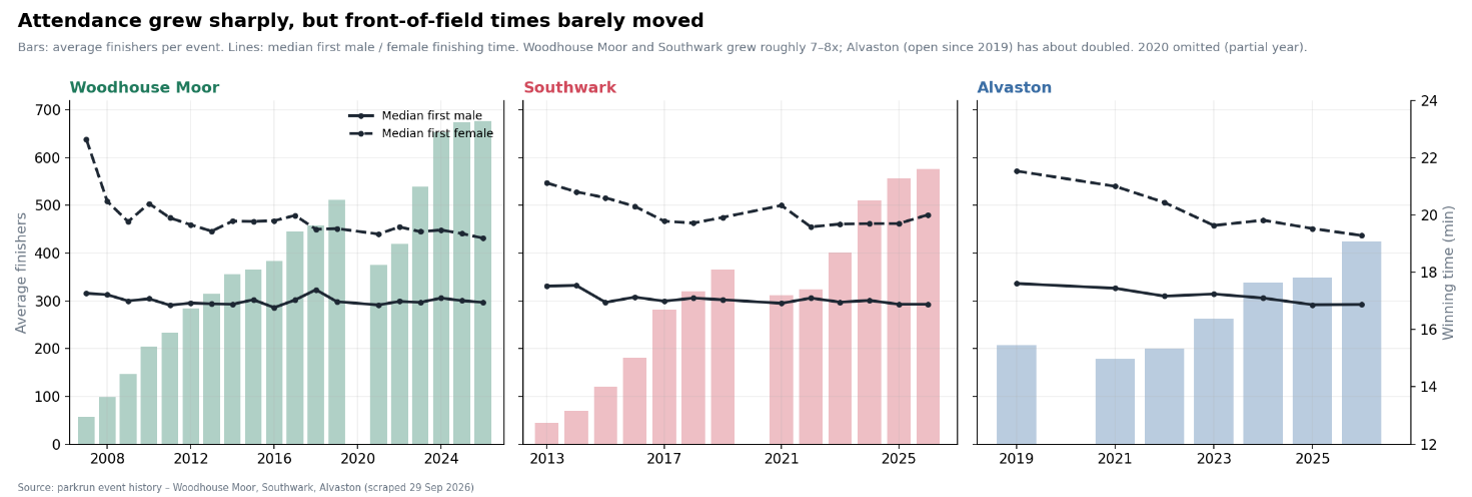 Average finishers per event (bars) against median winning times (lines).
Business takeaway: if inclusion matters to your programme, plan to measure it. Newcomer and low-intensity participation data are the signals most worth capturing.
5. From Behaviour to Value: The NHS Evidence
Our data describes the behaviour pattern: regular, repeated, widely distributed participation. It does not measure health outcomes. That is why recent work connecting parkrun to NHS costs is so relevant. Reported on parkrun’s blog, new Sport England data estimates direct NHS England savings from parkrun and its parkrun practice programme with the Royal College of GPs:
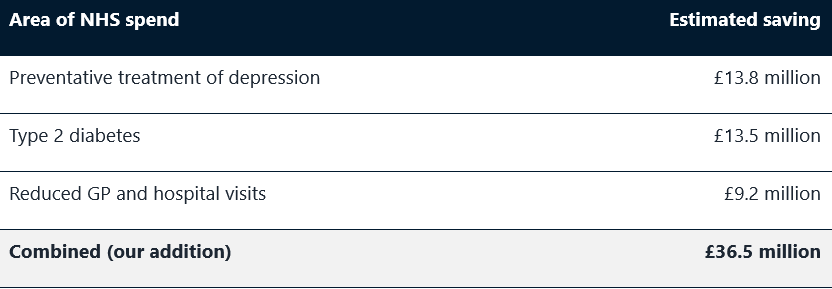
The same release points to earlier research led by Sheffield Hallam University (2024), which estimated that parkrun saves the UK economy, including the NHS, £667 million a year. A YouGov survey for parkrun found that 70% of Britons support GPs socially prescribing parkrun, and 52% think it could help ease pressure on the NHS. The timing matters too: it lines up with the government’s 10 Year Health Plan priorities of prevention and community-based care.
What Leaders Can Take From This
-
Design for the routine, not the launch. Weekly rhythm turned out to be the product.
-
Build shared ownership into delivery. Volunteer-run delivery keeps unit costs falling as the programme grows.
-
Keep it simple and predictable. Simplicity makes a programme resilient to disruption.
-
Measure what shows durable behaviour change. Trends, recovery times and reliability beat one-off headline numbers.
-
Close the data gaps on inclusion. Newcomers and walkers are the hardest groups to see and the most important to reach.
parkrun shows how simple, community-led programmes can deliver lasting impact when they’re designed around consistency, participation and measurable outcomes. At DSP, we help organisations unlock greater value and insight from their data to inform better decisions. Explore our Data Science Services or get in touch with our experts to find out more.
Notes and sources
Data: public parkrun event histories for Woodhouse Moor (from 2007), Southwark (from 2013) and Alvaston (from 2019), analysed to September 2026. Volunteer figures exclude events with missing counts. Charts show regular Saturdays unless stated.
NHS savings: parkrun, “New data shows parkrun’s savings to NHS England”, 26 March 2026 (blog.parkrun.com/uk/2026/03/26/new-data-shows-parkruns-savings-to-nhs-england/). The combined total of £36.5 million is our own addition of the three published figures.