- About
Getting to know us
- Services
- Managed Services
- Application Services
- Cloud Services
- Data Science
- Consulting Services
- Technology Solutions
Managed Services
Application Services
Data Science
Consulting Services
Technology Solutions
- Industries
- Resources
Resources
- Contact
- Contact us
OEM Chargeback via APEX
Contents
I was recently asked to look into the possibility of building a custom front end for some of the features of OEM 12c, namely the Cloud Management Plugin.
The customer in question is planning on using the Oracle Cloud (Database-as-a-Service) and on-premise Database instances to deliver a hybrid Cloud service to their users. The challenge by the customer was to prove that APEX can sit on top of DBaaS and on-premise Databases to provide usage metering and chargeback information to clients, rather than using the standard OEM interface.
The APEX environment was built on a completely separate environment to the OEM database so I had to authenticate using OEM credentials over a database link. This was achieved using a custom authentication scheme in APEX which utilised a method described in this old blog written by Dan McGhan.
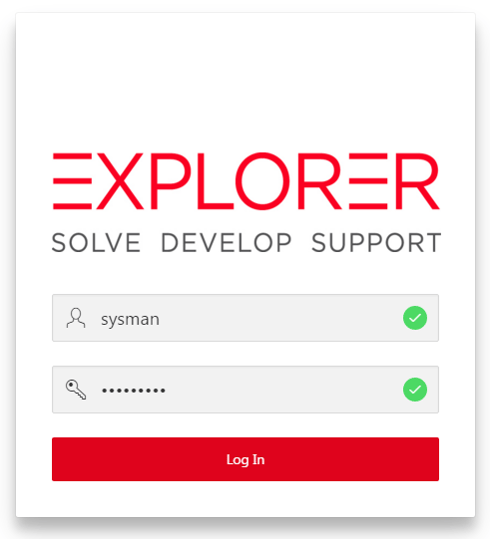
After implementing this custom authentication we can log in to the application using the same credentials that are used in OEM itself.
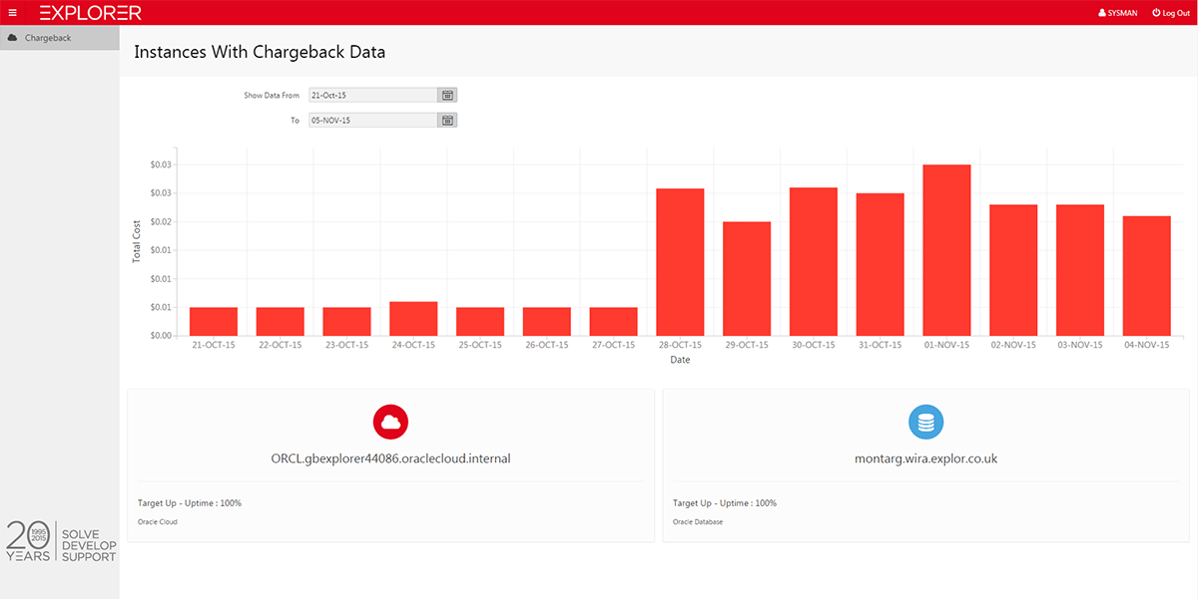
The first screen that the user is presented with is a visualisation of the total charges incurred over a time period along with a list of the databases with chargeback data available. A clean, minimalist version of the APEX 5 Universal Theme has been utilised along with D3 charting technology and the new card region to give us an attractive, modern looking UI that presents only the data that the user wants to see.
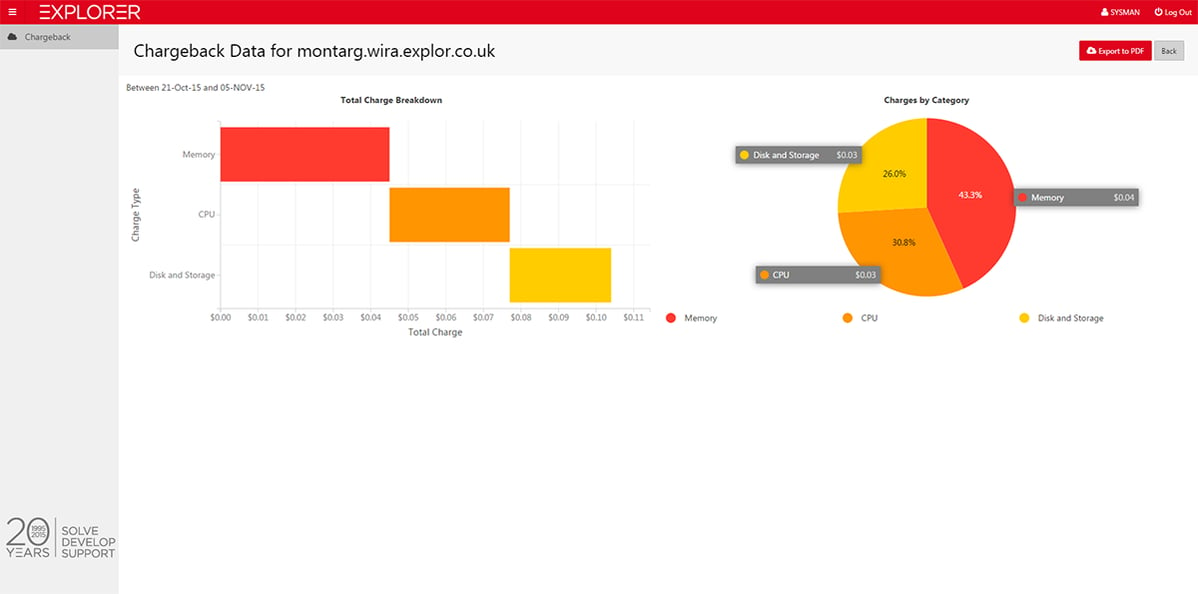
Clicking on one of the card regions takes the user to a more detailed view of the charges relating to that database.
The charge plans are configured in OEM and stats are gathered from both the on-premise Database and the Cloud instance.
Again, D3 charting is used to give the user a stacked bar and a pie visualisation of the components that make up the total charge for the database. I have chosen D3 for this application as I believe it creates a much more clean looking representation of the data than the in-built AnyChart charts. You can implement any existing charting library into APEX, for example the Google charting API also provides a wide range of modern looking visualisations.
The data behind the charts is simply selected from the OEM server via a database link, for example:
This code returns the total charge for all databases broken up by category. This query can be altered further to return charges for a specific database.
There is lots of documentation online about what views are available for reporting on and even the web service APIs that are available to allow external applications to perform OEM actions. If there is data you want to surface from OEM or actions you want to perform, the tables and APIs will be there for you to access.
So, in summary the steps you need to take to report on OEM data using APEX are:
• Create an APEX application with a custom authentication scheme connecting over a database link.
• Build your query on top of the OEM data you wish to surface.
• Build an APEX application using these queries as the basis of charts and reports.
• (Optional) implement external reporting frameworks to improve the application UI.
This was a small application on a really specific brief but I hope that shows you how easy it is to extend OEM using APEX and also the benefit of using a hybrid Cloud approach to Database provisioning and consumption.
If you want to see this POC in action or discuss APEX, Cloud or any other topic in more detail why not stop by and see me at the UK OUG Tech15 Conference.
See you in a few weeks!
Author: Craig Sykes
Job Title: Senior Oracle Development Consultant
Bio: Craig is a Senior Development Consultant at DSP-Explorer. Craig has an MSc in Computing Science and is an experienced software engineer, utilising development tools such as PL/SQL and APEX to provide bespoke ERP software to both UK and international businesses. Craig has experience developing solutions to connect Oracle systems to a wide range of existing external applications within business environments.

.png?width=250&name=stonewater-logo%20(1).png)


