- About
Getting to know us
- Services
- Managed Services
- Application Services
- Cloud Services
- Data Science
- Consulting Services
- Technology Solutions
Managed Services
Application Services
Data Science
Consulting Services
Technology Solutions
- Industries
- Resources
Resources
- Contact
- Contact us
JavaScript Debugging in APEX 5 (at last)
In APEX 4.2, I would debug JavaScript code using the alert() function. I would use this to show information about variables and the steps taken through code.
This method is far from ideal so big on my wish list for APEX 5 is JavaScript debugging… and after a long wait, it’s finally here, and better still, it’s really good.
APEX 5 delivers serveral new JavaScript APIs and the one which stood out for me is the apex.debug namespace.
There are 8 functions within this namespace so why not investigate them all and explore their capabilities.
I quickly created a simple Page, Region and Icon Button to invoke a JavaScript Dynamic Action.
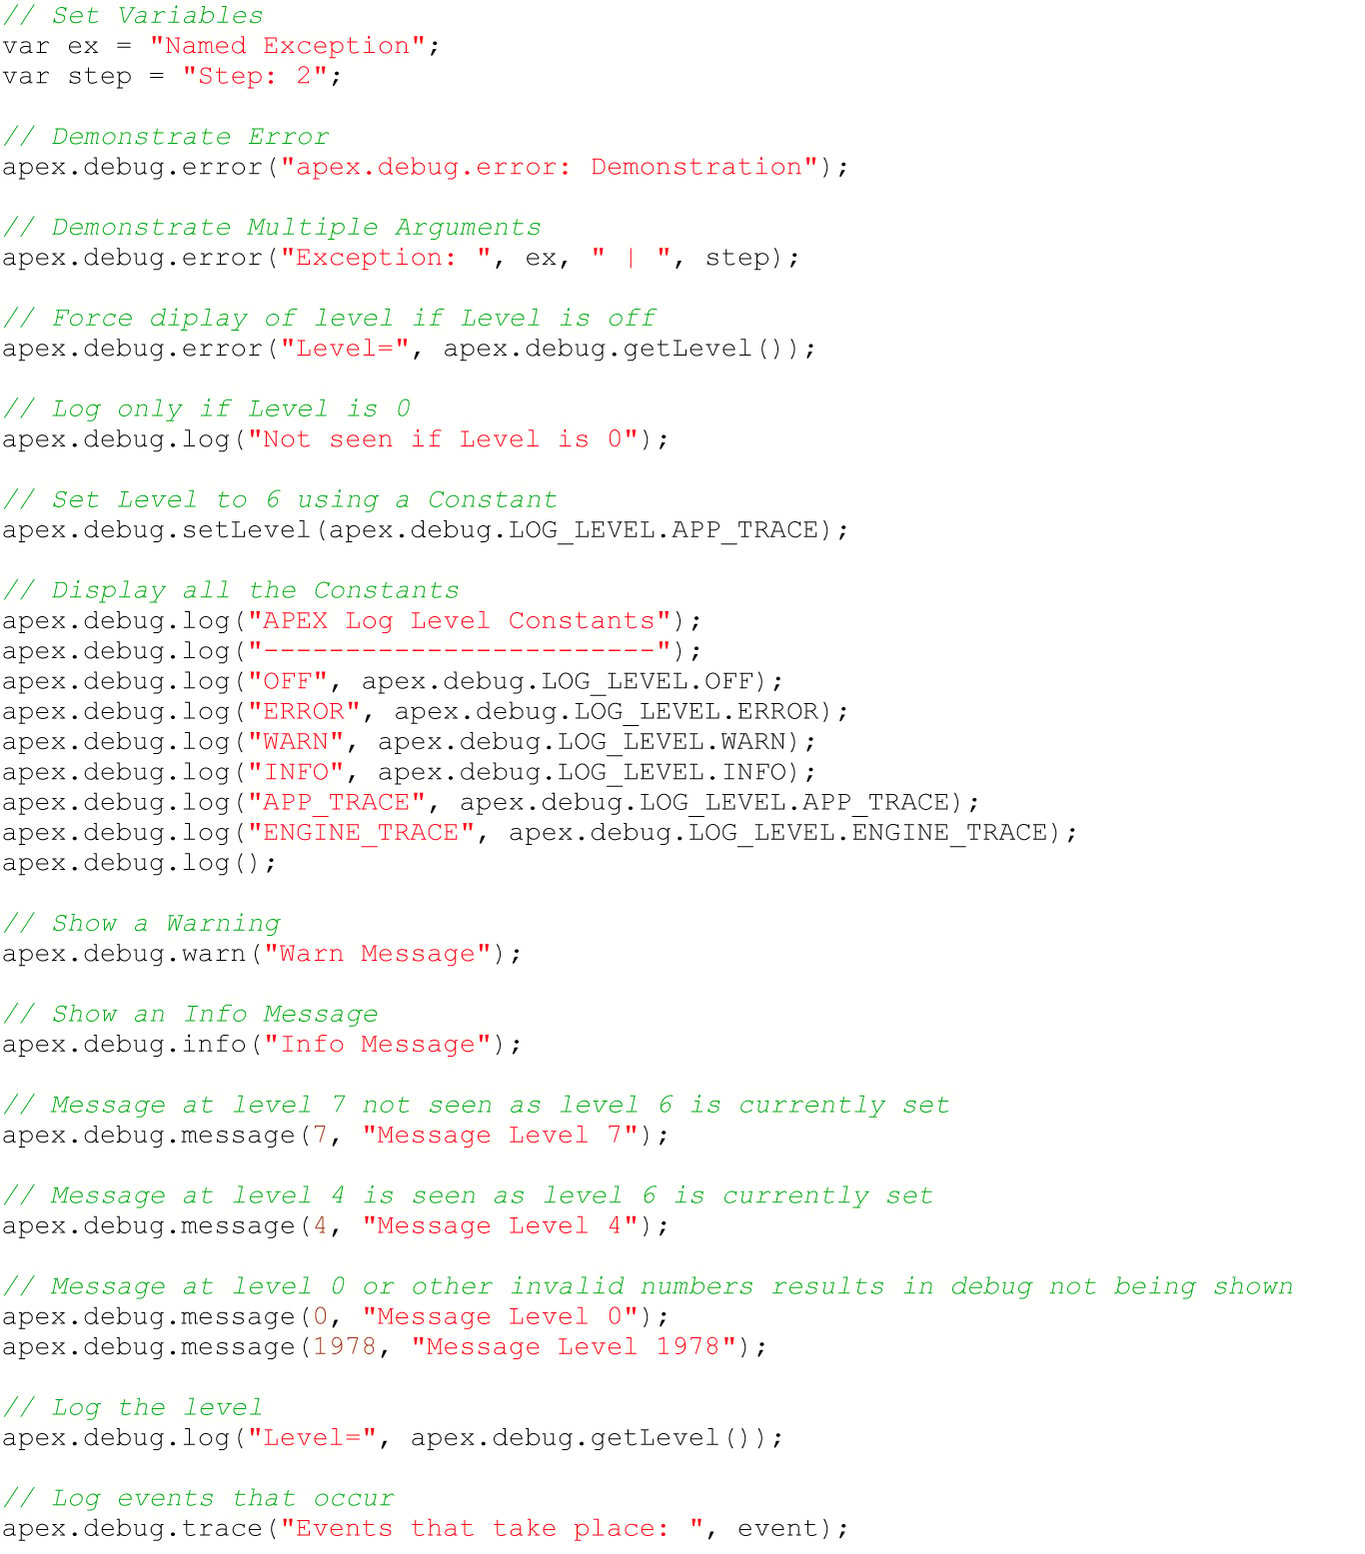
The JavaScript code is
Before you press the Icon Button you must activate your console window. I use Chrome for APEX development, so I just press CTRL+SHIFT+J. Once the Console is open, click on the button with the mouse.
So to talk you through this;
Without activating the APEX debug, it performs the following steps
- Logs an error. All calls to apex.debug.error are shown in the console regardless of the log level
- Logs an error with multiple parameters which is demonstrated using both literal strings and variables.
- Logs an error so that we can see the Log Level (even if no Level is set). We see that the Level is set to 0 (i.e. Turned off)
- Tries, and fails, to log a message to the console. It fails because the log level is 0. The log command just needs a level of 1 to display
- It then sets the log level to a value held in the constant APP_TRACE
- Lists all the constants. We then discover that APP_TRACE is log level 6
- Displays a Warning message. We get a yellow triangle in our console. (this needs a log level of 2 to display)
- Displays a Warning message. We get a blue info icon in our console. (this needs a log level of 4 to display)
- Tries a series of messages at levels 7, 3, 0 & 1978. We only see the level 4 message display as level 7 is higher that the level 6 we are using and 0 & 1978 are both invalid log levels for apex.debug.message
Displays the log level using the log command (instead of the error function we were using earlier)
Finally the apex.debug.trace command informs us of the click event when the button was pressed (more on this later!)
If we try to run the page again with APEX debug mode on (in the Developer bar) we see that it retains the APEX Debug default message level of 4 and now we can see the earlier supressed error message.
Turn APEX Debug off and we can explore more about apex.debug.trace and apex.debug.setlevel
For this next part we can create a PL/SQL True Action just after the JavaScript True Action. All we’ll use is the following code:
This is using the apex_debug database package to output a simple message to investigate if setting the log level to 6 in JavaScript could activate the Debug feature of APEX even if Debug was switched off. Let’s give it a go.
This is incredibly useful as I can now see what actions are being run (with even more detail if I choose to drill down in to the object in my console window). But where is my simple message?
Clicking on View Debug on the developer bar in APEX, I can now see a new entry with an unusual Path Info of ajax plugin
Clicking on its identifier I can now see my message.
So in summary; APEX 5 provides an array of functions which can control the debug log level throughout the application. It can provide several types of message, information, warning and error messages to the console and can give detailed information of APEX events through using apex.debug.trace
I’m very pleased with this API and I shall be using it frequently in all my development work.
For more information, check out our Oracle APEX Services, and if you liked this blog, check out our other APEX blogs here.
Author: Matt Mulvaney
Job Title: Senior Oracle APEX Development Consultant
Bio: Matt is an experienced APEX solution designer having designed numerous complex systems using a broad range of Oracle Technologies. Building on his previous experience of Oracle Forms & PL/SQL, he is entirely focused on providing functionally rich APEX solutions. Matt promotes APEX as a software platform and openly shares best practises, techniques & approaches. Matt has a passion for excellence and enjoys producing high quality software solutions which provide a real business benefit.

.png?width=250&name=stonewater-logo%20(1).png)


