- About
Getting to know us
- Services
- Managed Services
- Application Services
- Cloud Services
- Data Science
- Consulting Services
- Technology Solutions
Managed Services
Application Services
Data Science
Consulting Services
Technology Solutions
- Industries
- Resources
Resources
- Contact
- Contact us
Power BI vs. Qlik Sense
Contents
There are plenty of reporting solutions out there, but I wanted to compare two of the most well-known to see how easy they are to connect to an Oracle Database, what options are available, and how easy they are to use.
Setup and Connection
Power BI
Power BI is Microsoft's data visualisation solution and comes as part of Microsoft 365, so if you have a Microsoft account, it is free to use.
It can be used online through its cloud-based service, or you can download a desktop version to use locally. To connect to an Oracle OCI Database, you will need to use the desktop version. This is because you will also need to install the Oracle Data Provider for .NET tool to allow connection to the database. This tool will hold the TNSNAMES file that Power BI will use when connecting to the database.
Nevertheless, the installation and setup are pretty straightforward, as you only need to connect to the MS 365 account to gain access once the installation and setup are complete.
Qlik Sense
Qlik Sense is another solution specifically designed for data visualisation. It is part of a much larger suite of tools from QlikView, but like Power BI, it can be used through a cloud-based service or a desktop application.
You will need to set up an account, and with that, you get a 30-day free trial. After the free trial, a paid subscription will be required.
Connecting to an Oracle Database is also simple. You have the option of using a basic connection, an Oracle Wallet or a TNSNAMES file and there is no need to install anything else to get a basic connection working.
Features & UX
Power BI
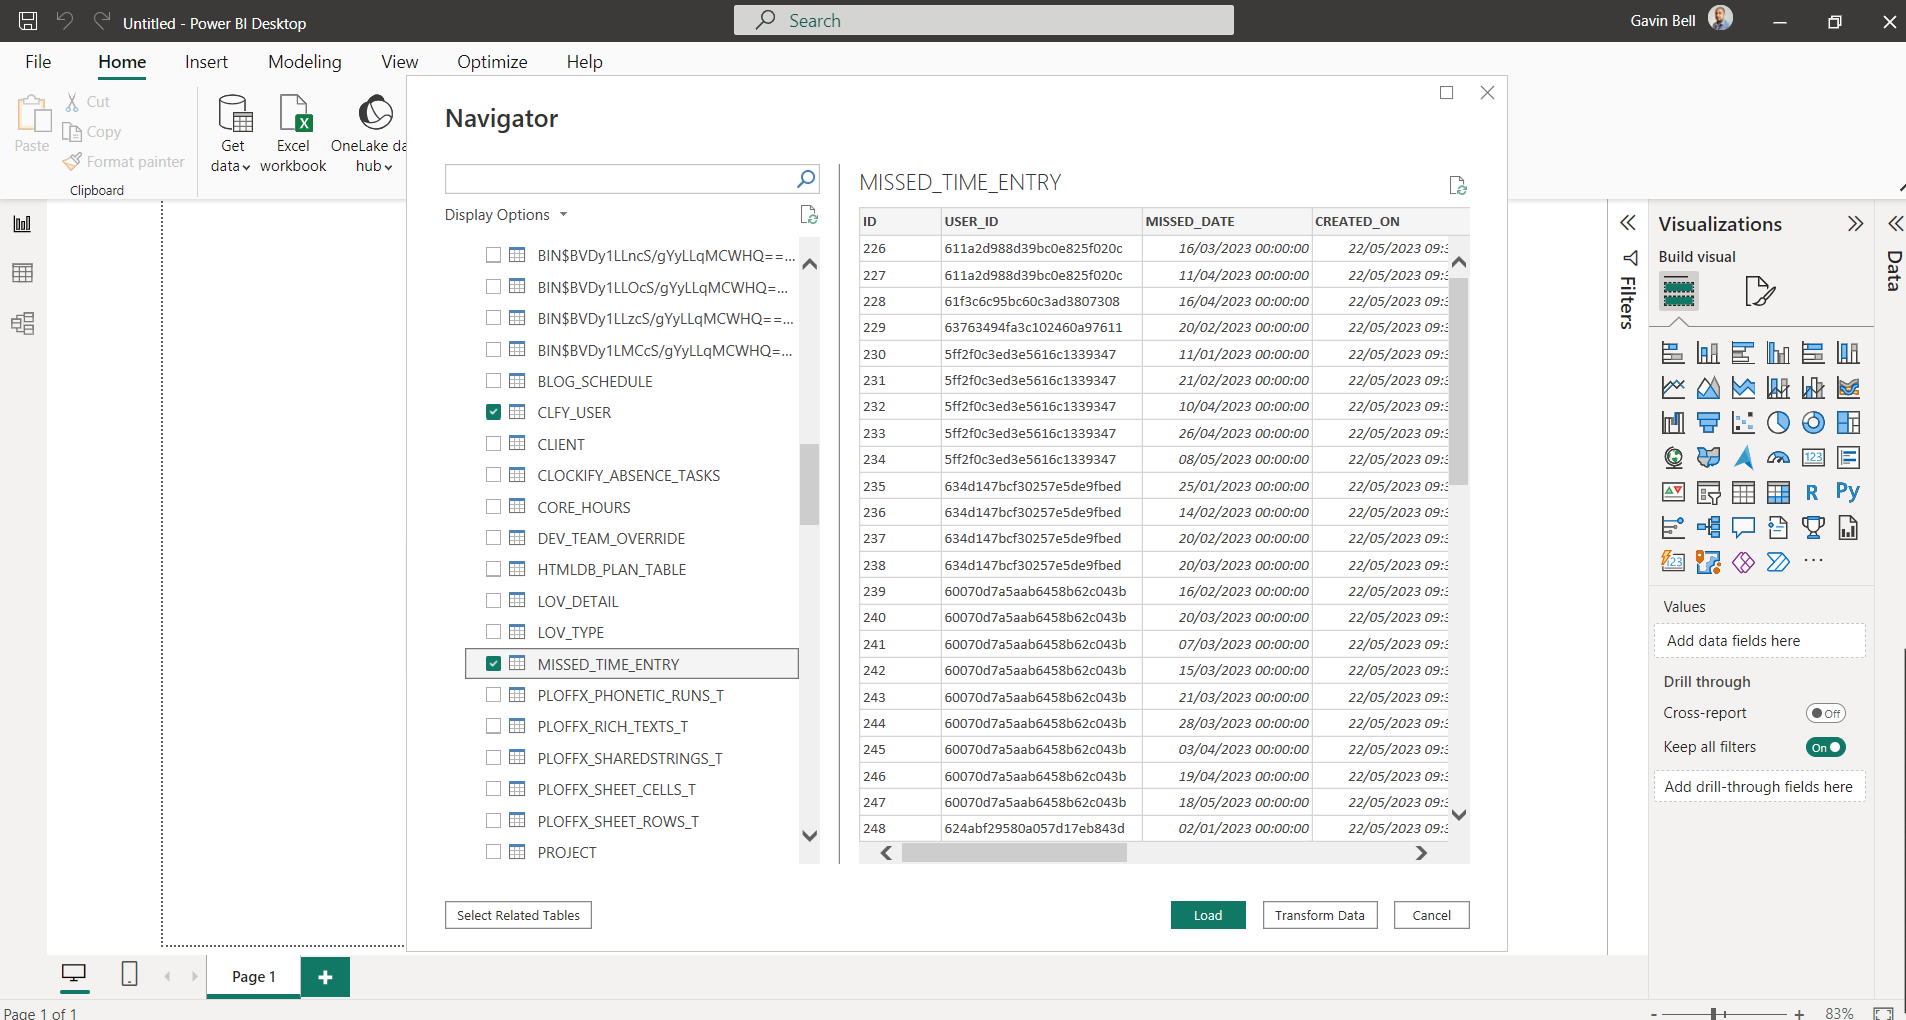
Once connected and using Power BI, you can load a dataset straightaway through the connection's setup during installation. There is no SQL necessary, but understanding the data and relationships between the different Database objects is an advantage.
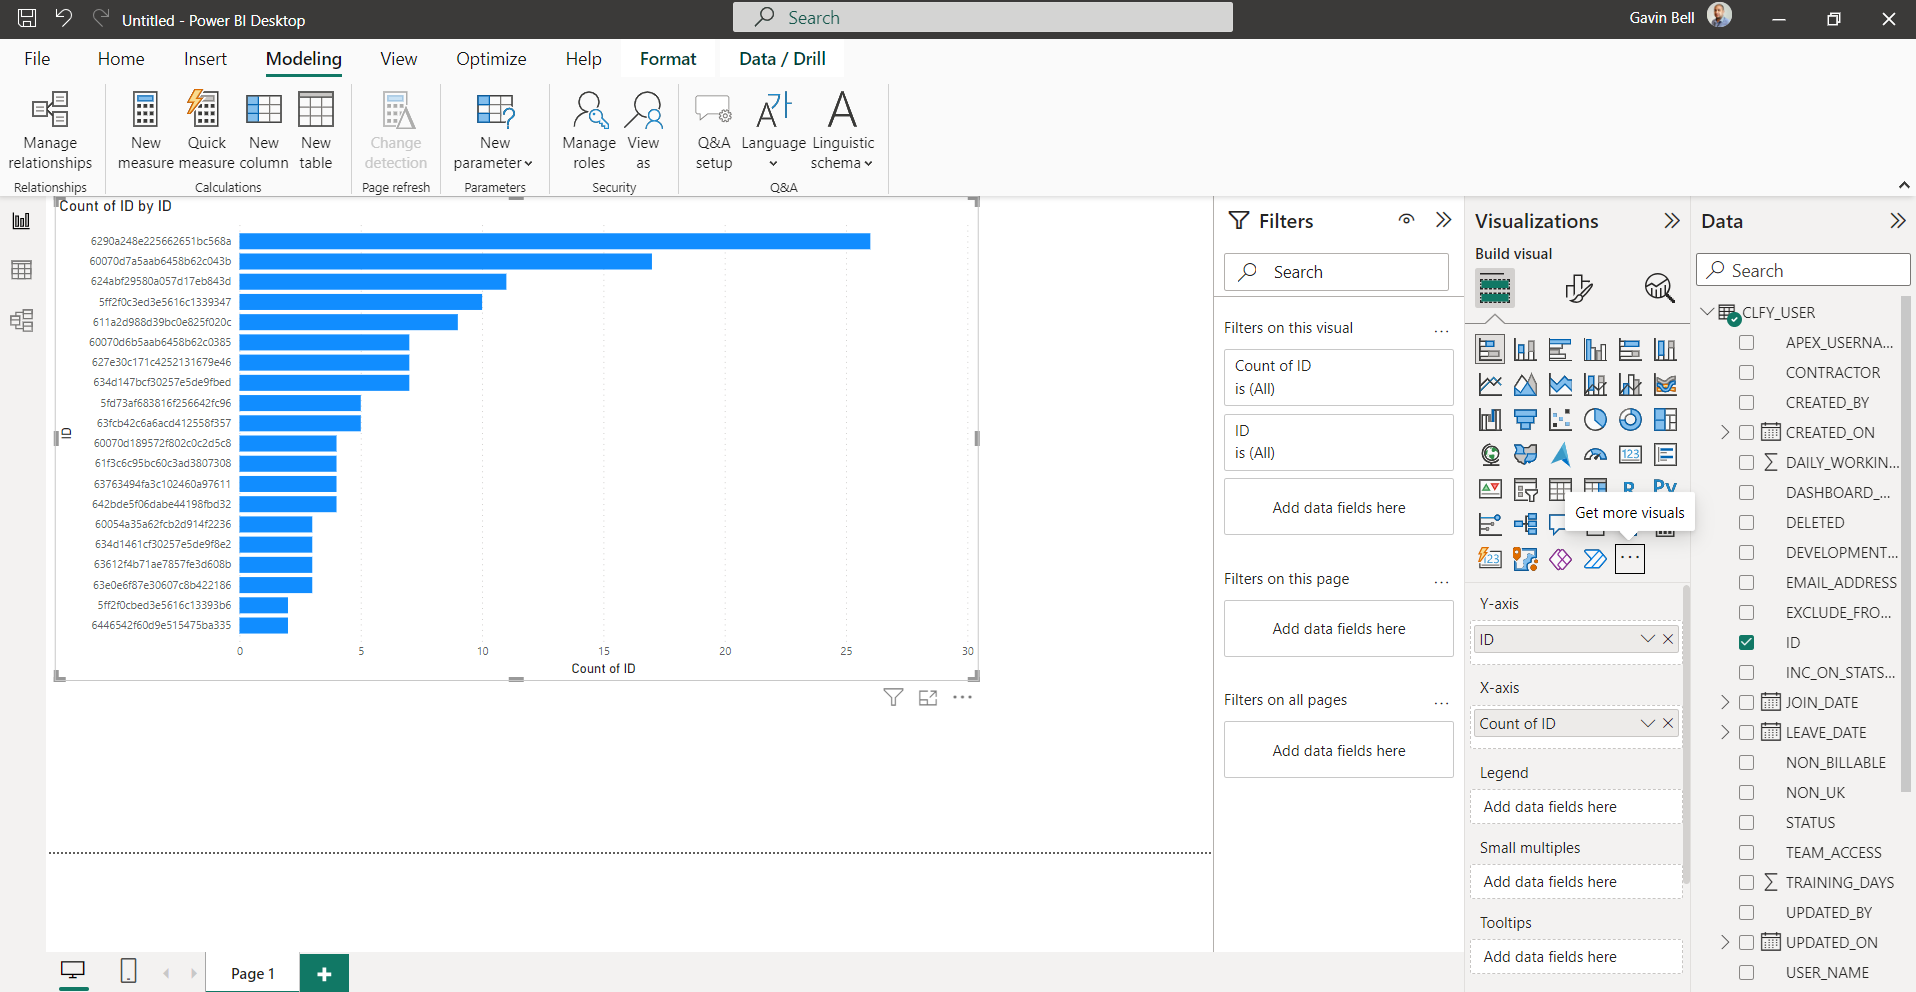
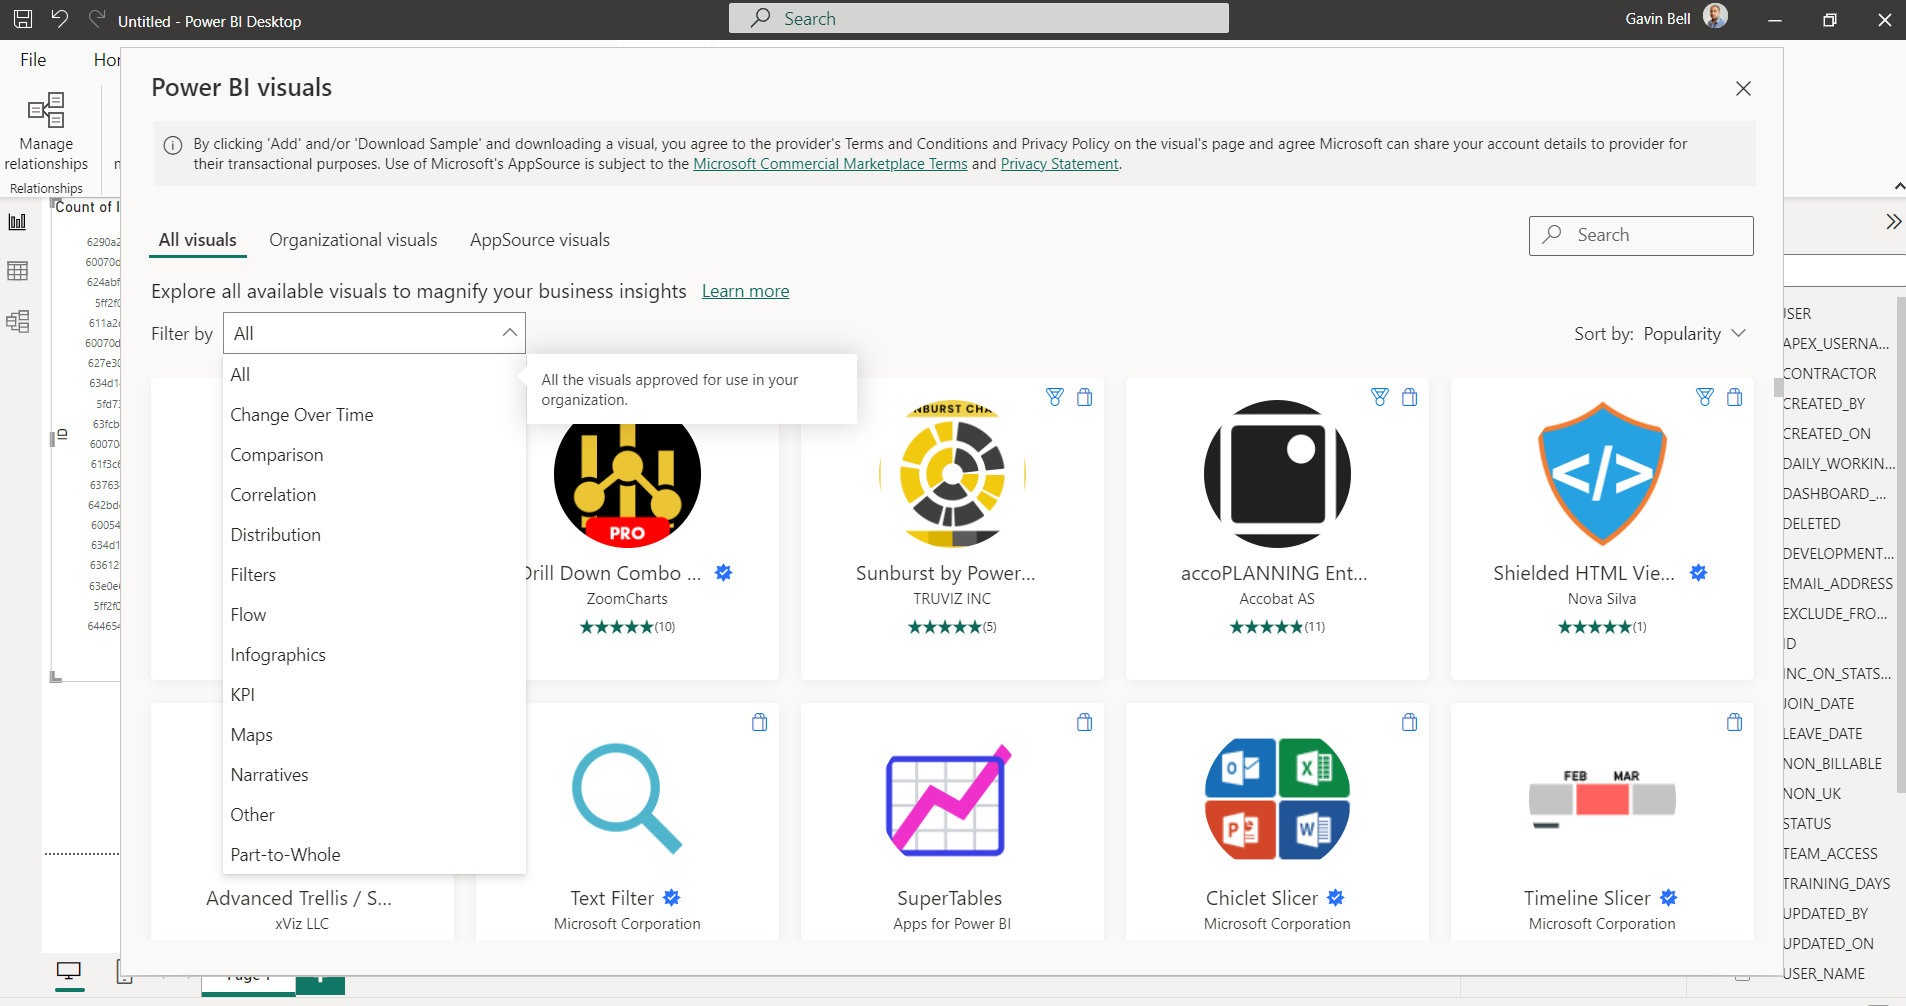
Selecting the data and generating charts off the back of that data is simple and quite intuitive. There are hundreds of different visualisations to choose from. So, whether you are looking for a simple bar chart or a more detailed Gantt chart or scatter diagram, there's something to cover all eventualities.
Selecting Tables/Data
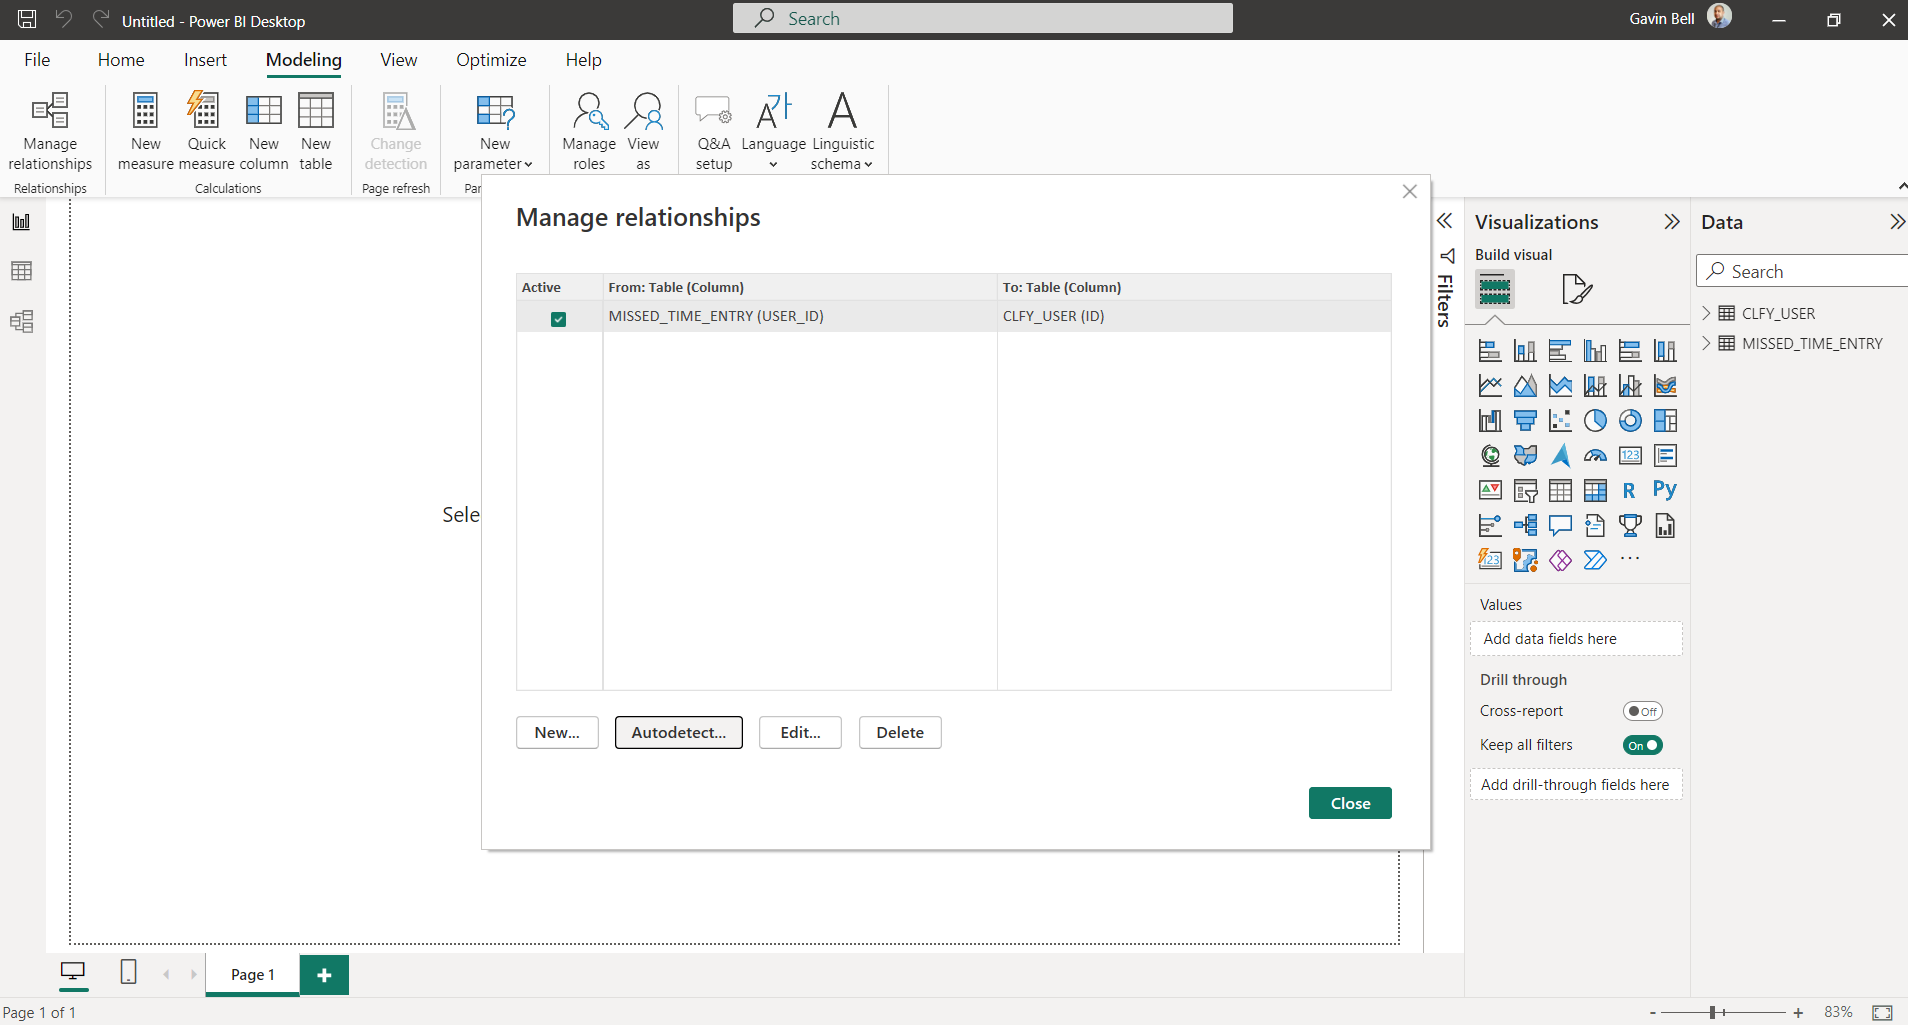
Managing Relationships
Basic Visualisation
Additional Visualisation
Qlik Sense
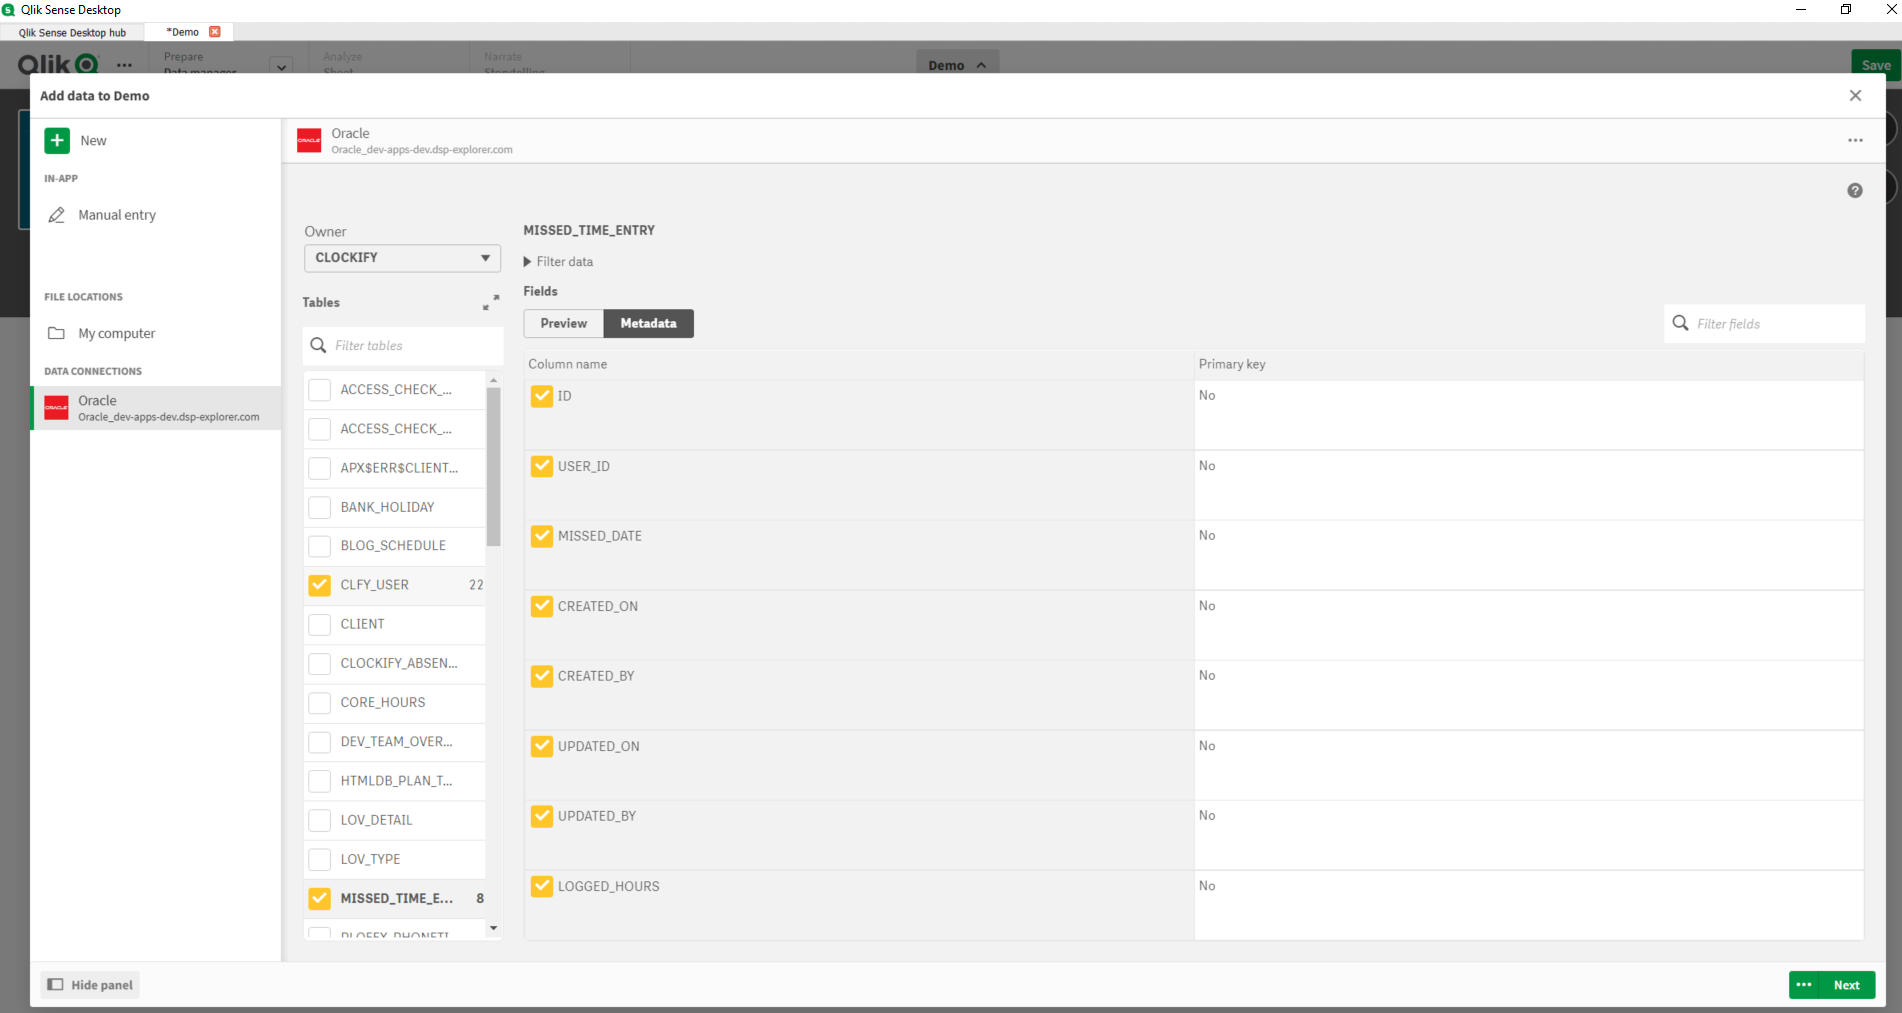
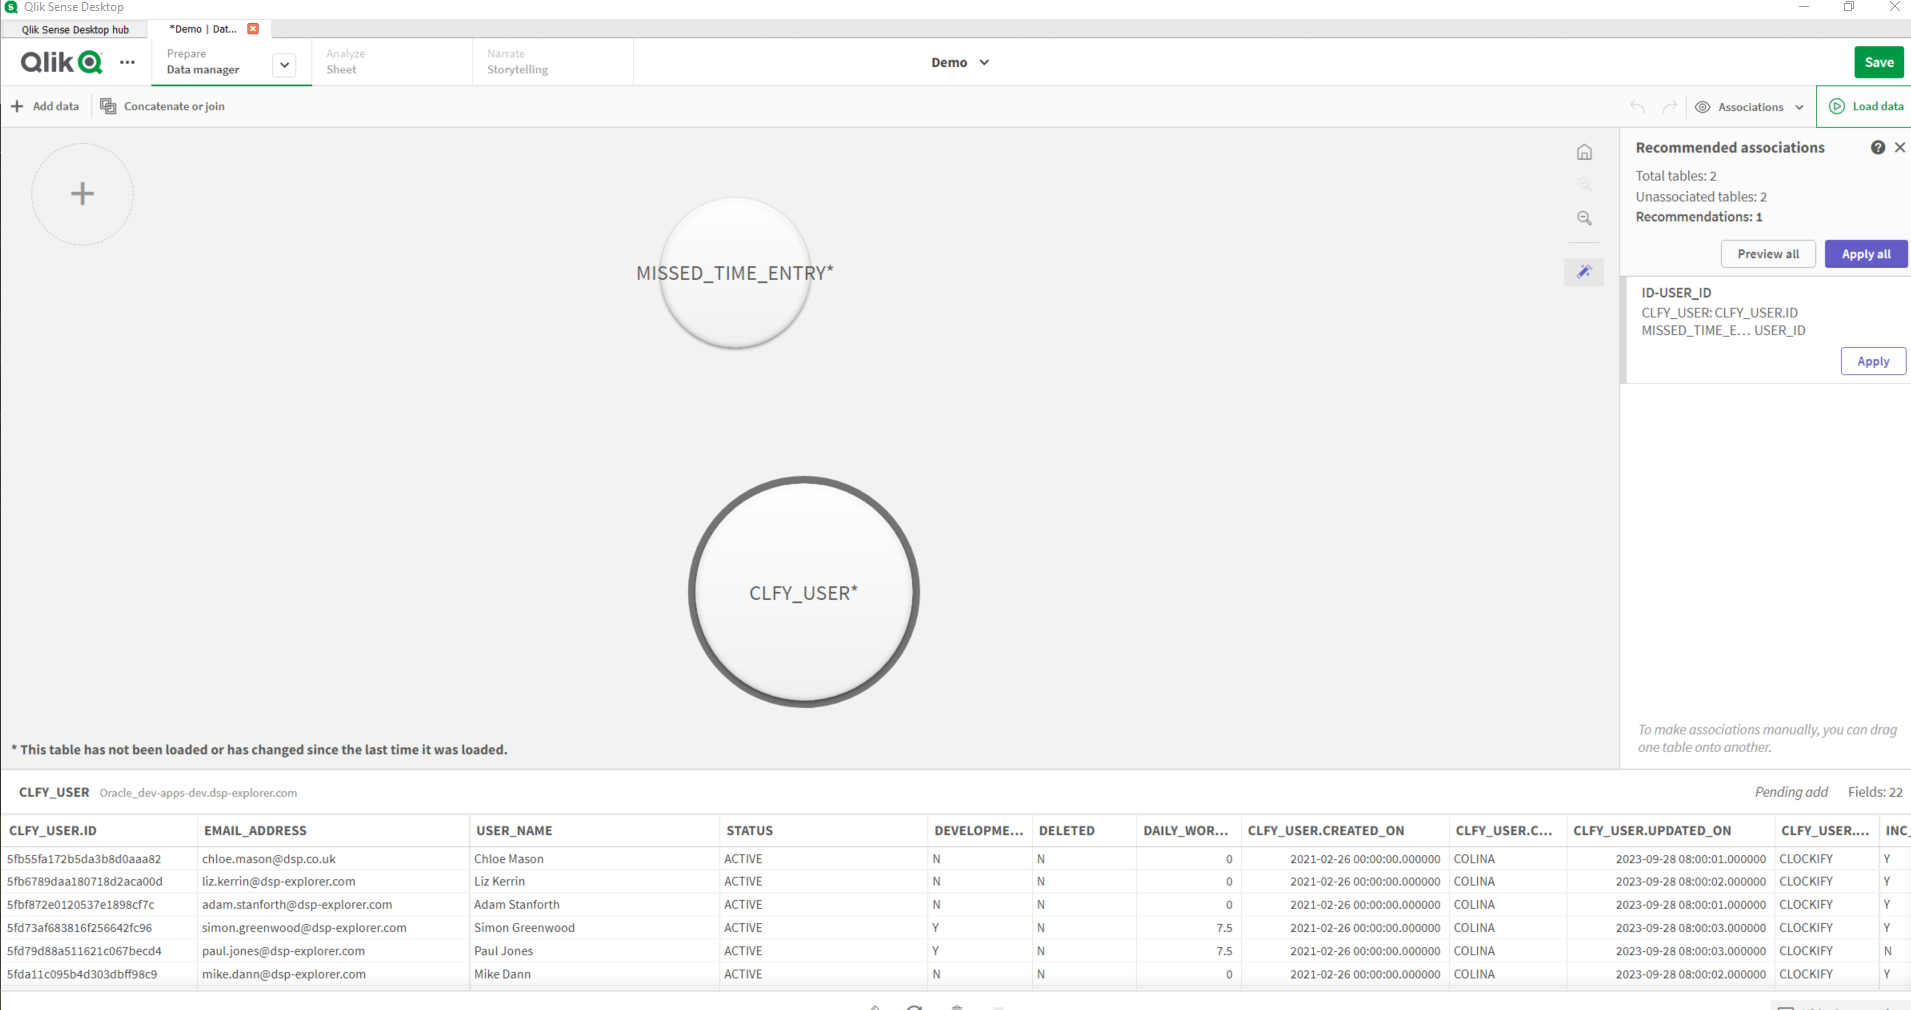
Qlik Sense is also very intuitive, and loading data is as simple as Power BI, but with the advantage that Qlik Sense will offer suggestions to join tables that link together during the data load process. As with Power BI, SQL knowledge is not necessary, but an understanding of data and tables relationships would be an advantage.
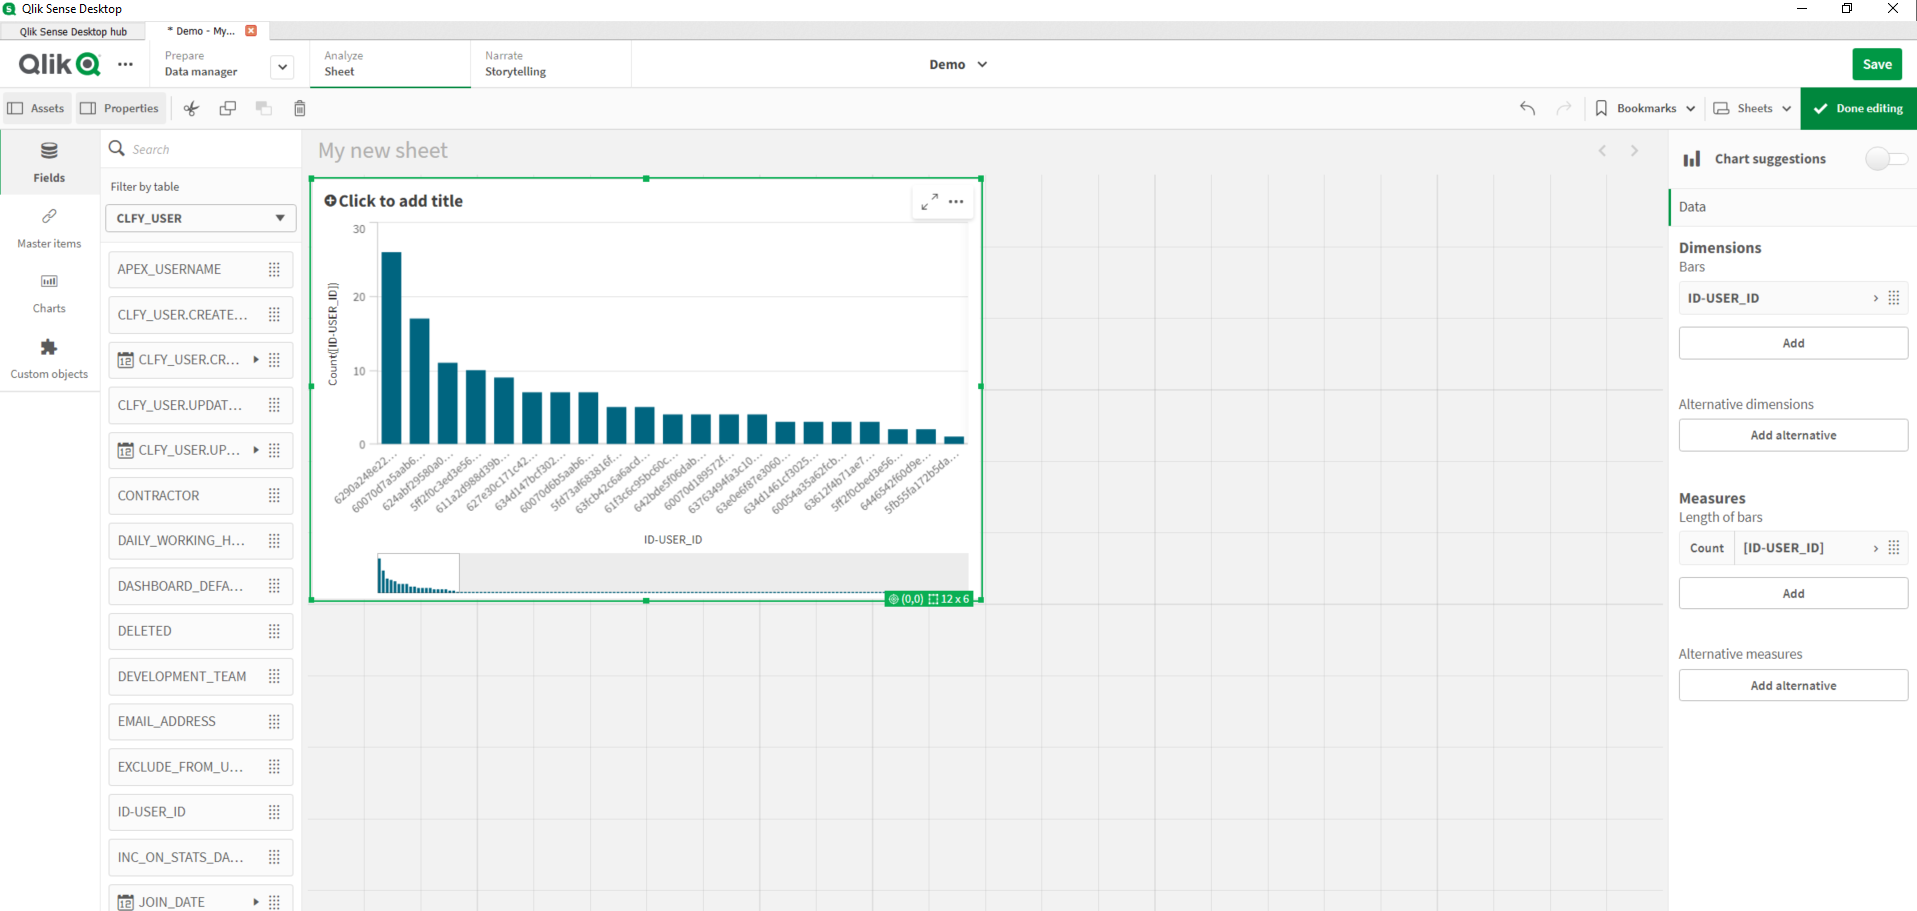
With Qlik Sense, there are many data visualisations to choose from and create a bright, detailed dashboard to represent your data.
Selecting Tables/Data
Managing Relationships
Basic Visualisation
Differences
As mentioned above, Qlik Sense suggests links to join related tables together to ensure the data is reporting correctly. However, Power BI does not present these suggestions and joining the tables is a manual step.
Another drawback of Power BI is the difficulty in changing the visualisation originally selected. If you change your mind after selecting a bar chart when you want a line chart, you need to delete that visualisation and recreate it. Whereas in Qlik Sense, you can easily edit the data visualisation and change the type of visualisation.
Conclusion
In conclusion, both solutions are great at building dashboards and data visualisation. Furthermore, both easily connect to an Oracle Database, can be created quickly, and loading data is straightforward and intuitive. If you need to decide which solution is best, it will depend on whether there is a budget to work under or if existing MS 365 accounts can be utilised. So, there isn't much between both solutions.
For more information, check out our Power BI page or our Business Intelligence Services. Alternatively, you can book a meeting with one of our experts below. If you liked this blog, check out our other blogs here.
Remember to follow us on LinkedIn. We publish insight blogs on the latest technology developments every week.

.png?width=250&name=stonewater-logo%20(1).png)

