- About

Getting to know us
- Industries
Recent case study:
Oracle EBS Cloud Deployment
Consolidating and Migrating assets into Oracle Cloud Infrastructure.
.png?width=250&name=stonewater-logo%20(1).png)
Most Visited Pages
-
- Resources
DSP-Explorer acquires leading Oracle Applications Managed Services Provider, Claremont, to further extend its data management capabilities.

Resources
- Contact us
Native Maps in APEX 21.1
Contents

Version 21.1 of APEX has recently been released and contains some great new features/improvements. I decided to take a closer look, starting with the new native map component.
This is a brand-new built-in feature of APEX that uses Oracles eLocation Service, allowing maps to be added to an application without the need to use third-party solutions or plugins. This means adding a map to an APEX application is very quick and easy to achieve. Plus, you don’t need to use API keys and it’s FREE!
The map region supports a good range of features and customisations.
- Choice of several background maps such as OpenStreetMap and Open World Map.
- Support for three geometry types, Longitude/Latitude, SDO_GEOMETRY and GeoJSON.
- The data source can be a local table or a REST.
- Multiple layers that can be toggled on/off.
- Layers can be points, lines, heat maps, polygons, or extruded polygons.
- Support for dynamic actions such as clicking on a pointer or map location.
- Zoom, scale and Compass options.
- Overview map.
- Circle and distance tools.
- Mouse wheel support.
- New APEX icon types.
To add a map to your application you can either use the wizard to add one as a new page or add one manually to an existing page using the new map region type.
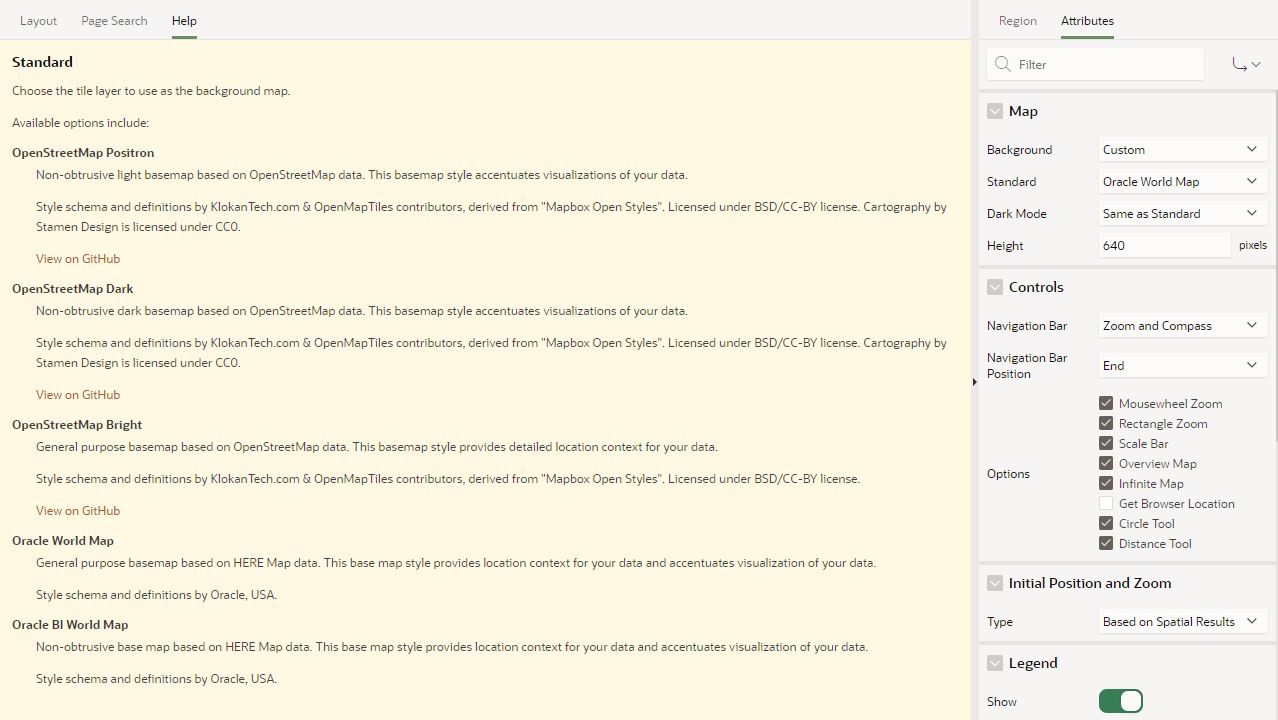
Let’s take a look at adding a new map page using the wizard, but before we start, don’t forget to use the built-in APEX help when learning how a new feature works. For example, if you want to know about the different map backgrounds available, click on the relevant attribute and display the help.
Adding a new Map page via the wizard
I am going to add a new map page to my application to display the DSP office locations using latitude and longitude coordinates held in a local offices table.
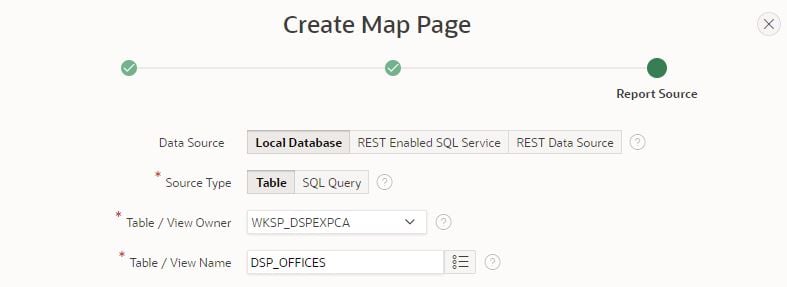
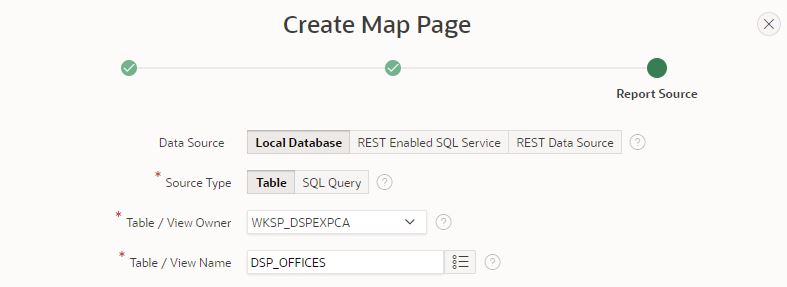
- The Create a Page wizard has a new Map type, select this option and specify the page name and number.
- The data source can be a local database or a REST source. For my example, I will be using the Local Database option and a table called DSP_OFFICES.
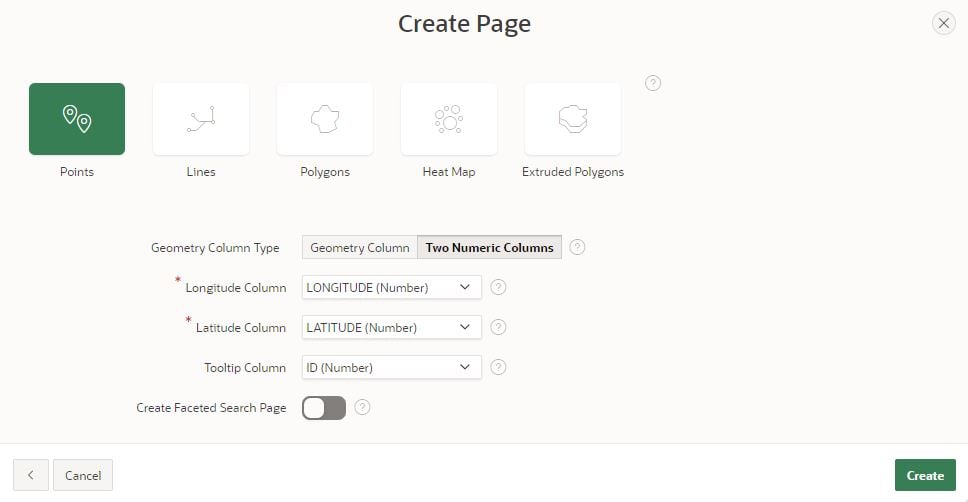
- Next, I need to specify the spatial geometry type and source. In this example, I am selecting Points to show office locations, which will be plotted using Latitude and Longitude values held for each row. The Maps also support the use of the SDO_GEOMETRY object type.

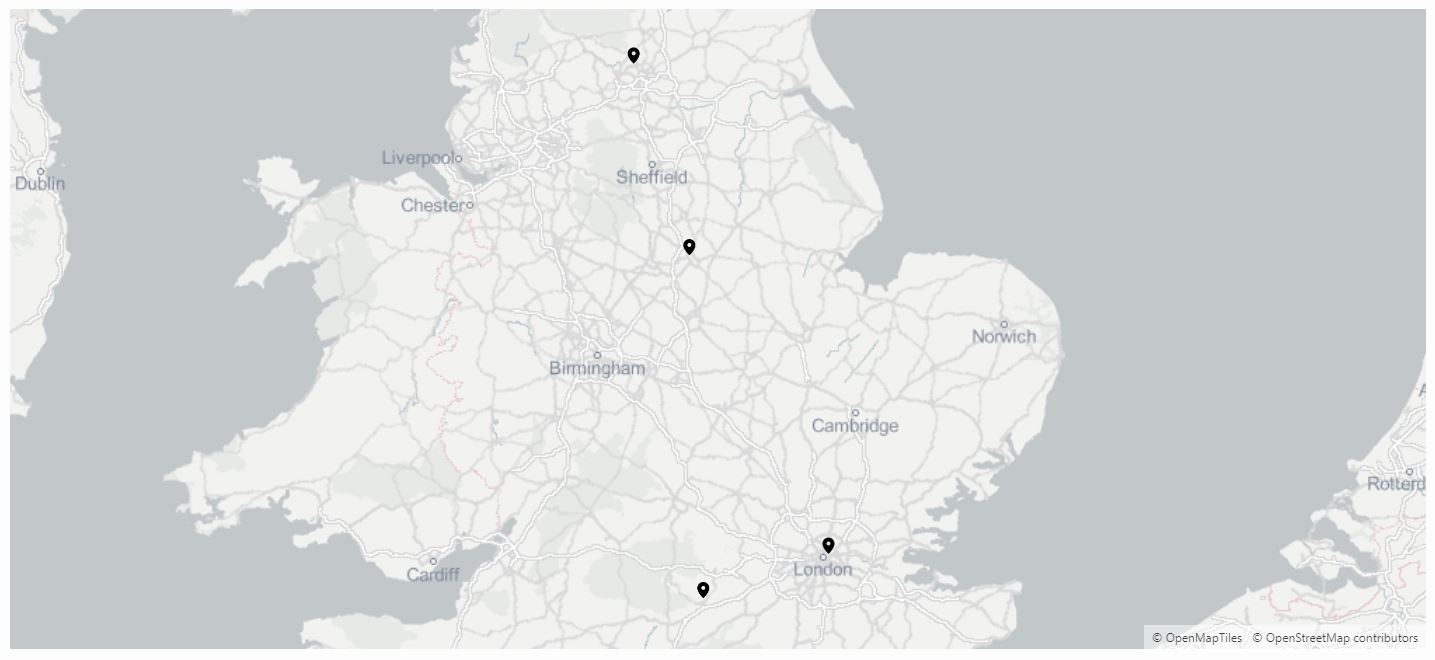
Once I press Create the new page is created and runs with the default settings to show the locations of the offices on the map.
Map Region Attributes
There are multiple attributes available for customising the map region, such as.
|
Map Background |
This changes the background map. There are currently five options to choose from. |
|
Navigation Bar |
Option to include a zoom and compass buttons |
|
Mousewheel Zoom |
Zoom in or out by using the mouse wheel |
|
Rectangle Zoom |
Zoom the map to an area by drawing a rectangle onto the map |
|
Scale Bar |
Display a scale bar on the map |
|
Overview Map |
Display an overview map in the lower right |
|
Infinite Map |
Infinite map scrolling |
|
Circle Tool |
The Circle Tool allows end-users to draw a circle onto the map. When finished, an event is triggered, so that the circle can be processed by Dynamic Actions or JavaScript code |
|
Distance Tool |
Allows end-users to measure distances between points on the map |
|
Legend |
Include a legend for the map layers, with the option to toggle on/off |
|
Units |
Switch between Metric and Imperial |
.
Layer Attributes
In addition to the region attributes, there are additional attributes for each layer that allow further customisation, such as.
|
Layer Type |
Type of layer, Points, Lines, Polygons, Heat Map or Extruded Polygons |
|
Icon Source |
Set the icon for a layer to a fixed source or column in the layer data source |
|
Appearance |
Set the Colour and Opacity |
|
Point Clustering |
Toggle on/off clustering of co-located points on the map |
|
Tooltip |
Set data and formatting of the information displayed when hovering over an object |
|
Link |
Set a link for an object. e.g. Open a page, application, or URL |
|
Into Window |
Set the details of a popup to be displayed when an object is clicked (When not using a link) |
|
Zoom Levels |
Set the minimum and maximum zoom levels (1-18) to display the layer |
|
Legend |
Set the layer to be included/excluded in the legend and if user can toggle on/off |
Customising my map page
I am now going to use some of the available region and layer attributes to customise my map of the DSP Offices.
Region Attribute Settings
|
Map |
|
|
Background |
Custom |
|
Standard |
OpenStreetMap Bright |
|
Height |
700 |
|
Controls |
|
|
Navigation Bar |
Zoom and Compass |
|
Mousewheel Zoom |
On |
|
Rectangle Zoom |
On |
|
Scale Bar |
On |
|
Overview Map |
On |
|
Circle Tool |
On |
|
Distance Tool |
On |
Layer Attribute Settings
|
Identification |
|
|
Label |
DSP Offices |
|
Point Object |
|
|
Style |
Icon |
|
Icon Source |
Icon Class |
|
Icon |
fa-map-marker-shine fa-3x |
|
Appearance |
|
|
Fill Colour |
#5F237E |
|
Fill Opacity |
0.7 |
|
Tooltip |
|
|
Column |
TOWN |
|
Info Window |
|
|
Title Column |
OFFICE_NAME |
|
Body Column |
POSTCODE |
|
Legend |
|
|
Show |
On |
|
Enable to Hide |
On |
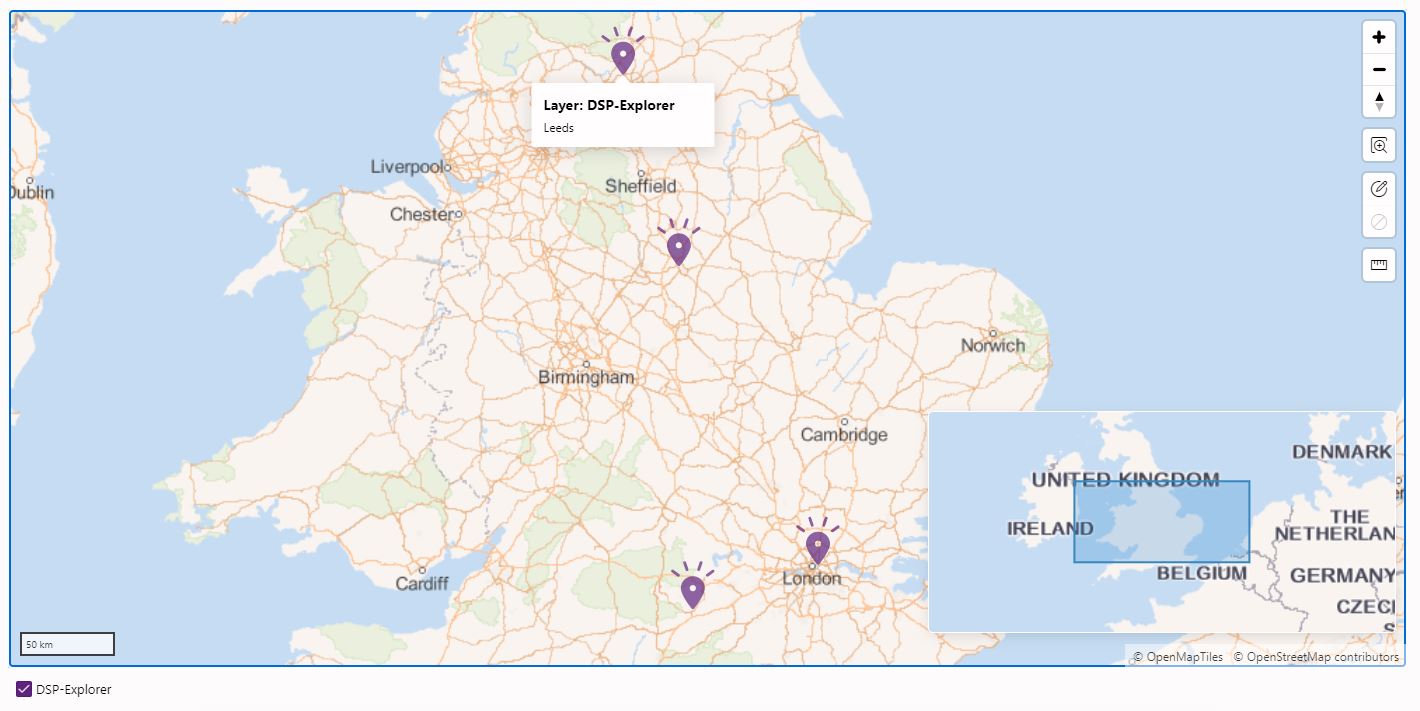
As you can see, the map looks very different now compared to the initial version.
Dynamic Actions
There are four new dynamic action events for using with the map region
- Map Changed - User changes the map view, e.g. zoom in or pans right
- Map Clicked - User clicks on the map
- Map Initialized - After the map has loaded
- Map Object Clicked - User clicks a layer object, e.g. A layer icon is clicked
Let’s look at a simple example of how you can use the map clicked dynamic action. I am going to add a second layer of points to the map which will be added to at runtime by the user.
To do this I will use an APEX Collection to store the latitude and longitude of each map click event, which will be the data source for a second points layer on the map.
- Add two hidden items to the map region called P10_LAT and P10_LNG to store the latitude/longitude values when the user clicks on any area of the map other than an existing layer object.
- Add a before header process called Create Markers Collection.
- Add PL/SQL to create/truncate a collection called MARKERS. APEX_COLLECTION.CREATE_OR_TRUNCATE_COLLECTION('MARKERS');
- Add a Map Clicked [Map] event dynamic action to the Map region called Store Lat/Long.
- Add a Set Value true action using the JavaScript Expression this.data.lat to store the longitude value in P10_LAT, ensuring it does not fire on initialisation.
- Add a second Set Value true action using the JavaScript Expression this.data.lat to store the longitude value in P10_LNG, ensuring it does not fire on initialisation.
- Add a dynamic action to fire when P10_LAT changes called Add Pointer.
- Add a PL/SQL server-side-code true action to add the new latitude/longitude values to the MARKERS collection, ensuing both items are submitted into session and it does not fire on initialisation. APEX_COLLECTION.ADD_MEMBER(p_collection_name => 'MARKERS' , p_n001 => :P10_LAT, p_n002 => :P10_LNG);
- Add a second REFRESH true action to refresh the map region.
- Add a second layer to the map region to display the markers.
-
- Right-click on the map region in the rendering tree and select Create Layer.
- Change the source to SQL Query SELECT seq_id, n001 lat_val, n002 long_val, 'Custom Marker '||seq_id info
FROM APEX_COLLECTIONS
WHERE COLLECTION_NAME = 'MARKERS'; - Set the column mapping to use the latitude / longitude values and SEQ_ID for the primary key.
- Set the points object to use an icon class and set the icon to fa-map-pin-circle with a colour of #e70303.
- Set the Tooltip column to INFO.
-
Now when I run the page, each time I click on the map the co-ordinates are recorded and the map refreshed to add the new pin.
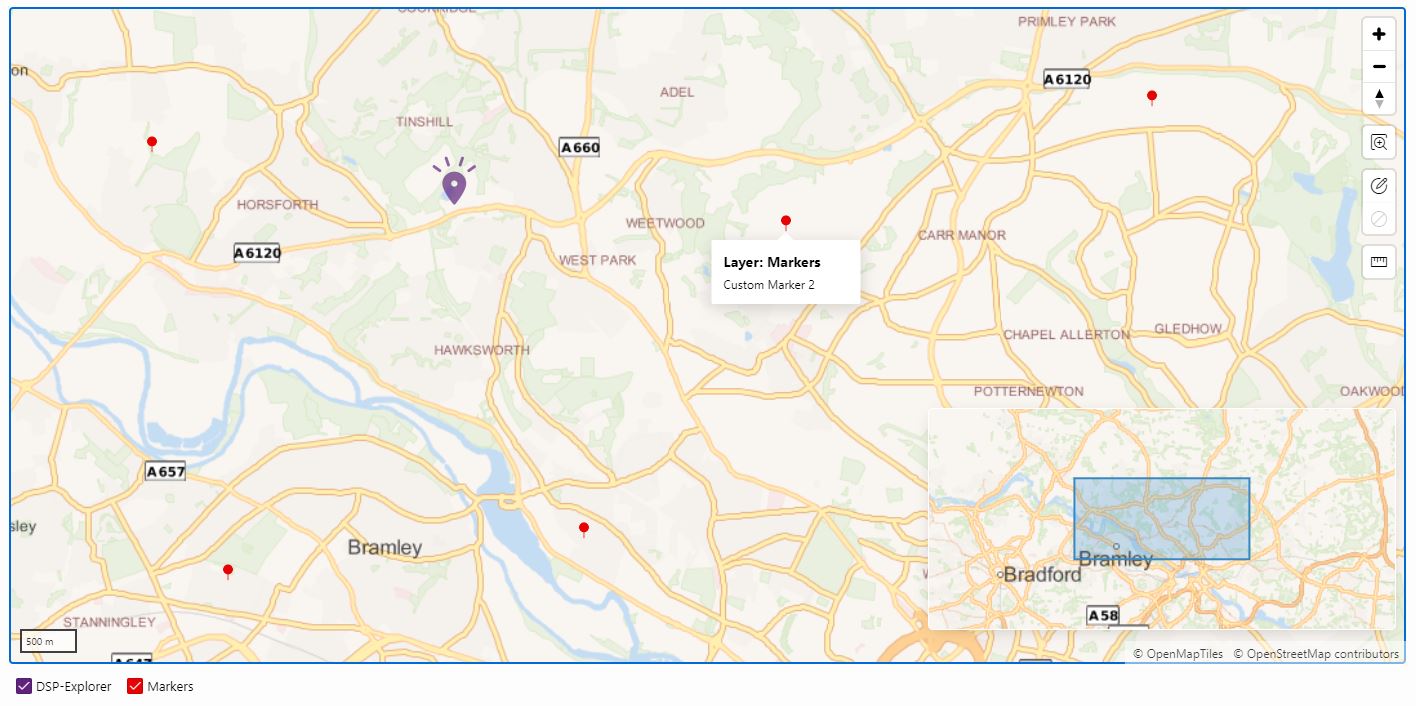
This is a very simple example of what you can do but demonstrates that the dynamic actions can easily be used to make your APEX map regions interactive.
If you would like to look at the example map page I built, it is available at apex.oracle.com.
Author: Colin Archer
Job Title: Team Leader (Oracle Development Services)
Bio: Colin is Team Leader at DSP with 20 years of experience in the analysis, design, and development of bespoke Oracle applications for a wide variety of business functions. Building on his previous experience of Forms and PL/SQL he is now focusing on developing high quality fit for purpose solutions using APEX.