- About

Getting to know us
- Industries
Recent case study:
Oracle EBS Cloud Deployment
Consolidating and Migrating assets into Oracle Cloud Infrastructure.
.png?width=250&name=stonewater-logo%20(1).png)
Most Visited Pages
-
- Resources
DSP-Explorer acquires leading Oracle Applications Managed Services Provider, Claremont, to further extend its data management capabilities.

Resources
- Contact us
New REST features of 18.1 (Early Adopter 2)
Contents
I recently published a set of blogs on the subject of ORDS, Outh2 and Web Services in APEX 5.1. In part three (available here) I detailed how to use a REST Service as the source for an Interactive report.
This involved the following steps:
- Define the REST Service within Web Service Modules.
- Call the Web Service Module from your APEX Page via a ‘Web Service’ type process.
- Use the APEX_JSON package to parse the response and extract the data to an APEX Collection.
- Use the Collection as the source for the Interactive Report.
On the 12th March, Oracle released the second early adopter for APEX 18.1, which contained some exciting new REST features. One of the most significant new features was the ability to use a REST Service rather than a local database as the source for components such as Classic Reports, Interactive Reports and Jet Charts, without needing to parse the response manually. Furthermore, you can now use the new Local Post Processing feature to transform the data retrieved by the REST Service before using it as the source for your report or chart, etc.
The following tutorial details how to use these new features and was built using the sample REST Services for the EMP and DEPT tables available as part of the Early Adopter instance. To try it for yourself request a Workspace and then register the schema for ORDS via ORDS RESTful Services within the SQL Workshop.
Define the REST Service
The first step is to define the REST Service within the new Web Service Modules. I am using the empinfo Web Service from the sample HR module, which I have modified to return the department name in addition to the employee details.
The URL for this REST Service is https://apexea.oracle.com/pls/apex/caordstest/hr/empinfo/
After you have created a new application, open Shared Components, select Web Service Modules and follow these steps.
- Press ‘Create’, select the from scratch option and press ‘Next’.
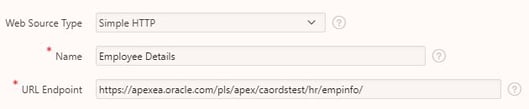
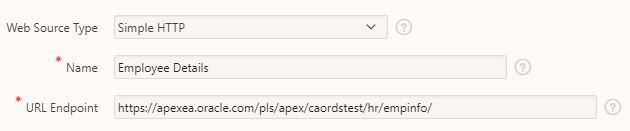
- Choose ‘Simple HTTP’ for the type and enter ‘Employee Details’ for the name. Then enter the REST Service URL and press ‘Next’.
- The next page splits the base URL and the Service Path, keep the defaults and press ‘Next’.
- As no authentication is required just press ‘Discover’ to test the REST Service.
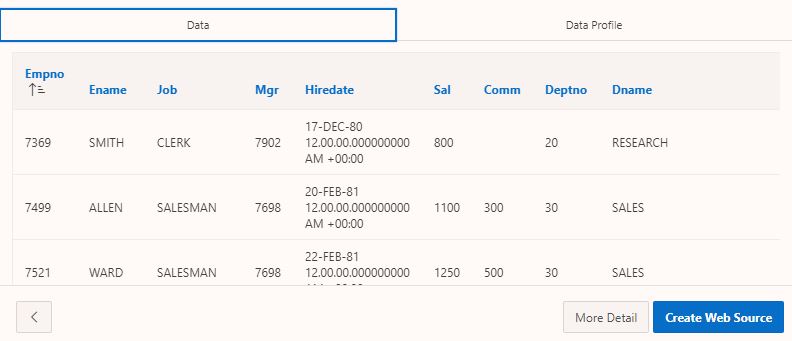
- The final page displays the response from the empinfo Web Service; you can switch between the data and data profile tabs to see the response. Press ‘Create Web Source’.
Now the module has been created you can click on it to review the details, operations and data profile.
.jpg)
You can see the response is a JSON object containing 9 columns of data. You can use the ‘Edit Data Profile’ button to review the data profile, which allows you to rename the columns and hide any you do not want visible.
Creating an Interactive report for a Web Source
Once the Web Source Module has been created, we can use it as the data source for a report. Follow these steps to create an interactive report of employees.
- Create a new page.
- Select Report and then select Interactive Report.
- Enter a suitable name for the page and press ‘Next’.
- Select the option to create a new navigation menu entry, enter a name and press ‘Next’.
- Change the Data Source to ‘Web Source’, select ‘Employee Details’ for the module and press ‘Create’.
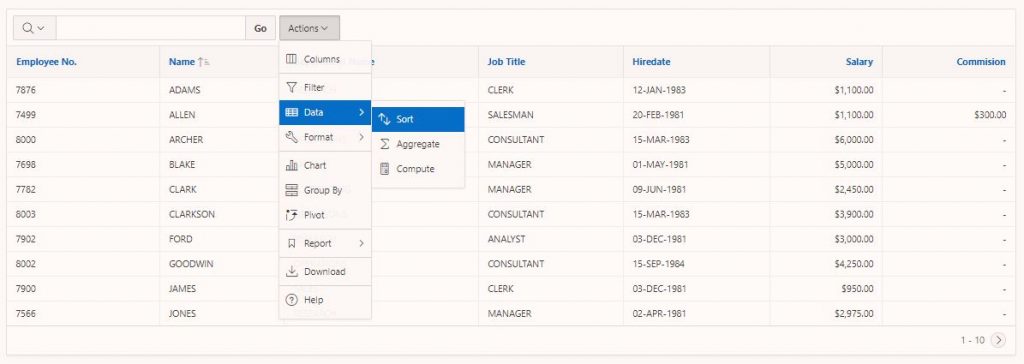
Run the page and you will see it contains an interactive report of employee details. It has been populated via the REST Service without the need to do any manual parsing of the JSON response.
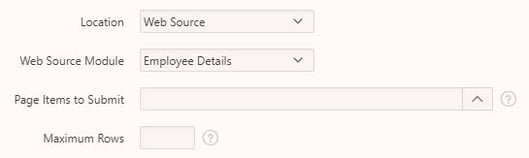
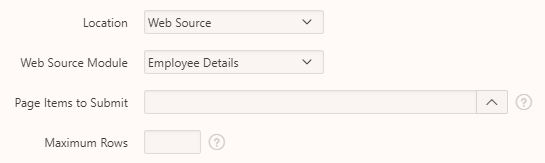
Back in the Application Builder examine the page and you will see the region looks the same as if it were using a local database table as its source. Within the source section of the region properties you can see the location is set to ‘Web Source’ and the module is set to ‘Employee Details’. If you expand the columns of the region in the rendering section you can make all the usual changes, such as hiding columns, updating the heading, changing the alignment and adding format masks etc.
Local Post Processing
Another new feature is the option to add local post processing to your REST Service call; this allows you to transform the returned data before it is used for your component.
The following steps will show you how to add local post processing to create a chart of total salaries by department using the same Web Source Module as we used for the interactive report.
- Create a new page, selecting Chart and then select Bar for the type.
- Enter a suitable name for the page and press ‘Next’.
- Select the option to create a new navigation menu entry, enter a name and press ‘Next’.
- Select ‘Web Source’ for the location and ‘Employee Details’ for the module and press ‘Next’.
- Select ‘EMPNO’ for the label and ‘SAL’ for the value and press ‘Create’.
If you run the page, you will see we have created a bar chart of salaries for each employee.
.jpg)
Now follow these steps to add some local post processing so that we can change the chart to show the total salary for each department.
- Edit the page and click on ‘Series 1’ in the rendering tree under the Salaries region.
- Open the series properties and change the local post processing type to ‘SQL Query’ to display the query used for the chart. Notice that the source is #APEX$SOURCE_DATA#
- Update the SQL Query to use the following.
SELECT dname,
  SUM(TO_NUMBER(sal)) salary
 FROM #APEX$SOURCE_DATA#
 GROUP BY dname
- Within Column Mappings, change the label to ‘DNAME’ and the value to ‘SALARY’.
.jpg)
Now save and run the page to see we now have a bar chart showing the total salary for each department.
.jpg)
The original response data returned by the REST Service has been successfully ‘Post Processed’ to give us the data in suitable format for the bar chart.
Author: Colin Archer
Job Title: Senior Oracle APEX Development Consultant
Bio: Colin is a Senior Development Consultant at DSP-Explorer with 20 years’ experience of analysis, design, and development of bespoke Oracle applications for a wide variety of business functions. Building on his previous experience of Forms and PL/SQL he is now focusing on developing high quality fit for purpose solutions using APEX.